When you look at steady dividend growth, you expect to find utilities, pipelines, or maybe a telecom. But every now and then, a consumer-facing brand breaks into the conversation by doing something rare: growing consistently, expanding globally, and becoming a staple in households. This business fits that profile. It’s not cyclical like energy, nor structurally challenged like traditional retail. Instead, it sells products people buy month after month, often for years.
And while the market has punished many small caps over the past two years, this name has quietly continued expanding its reach, especially in high-growth international markets. It’s also part of the Canadian Dividend Aristocrats, reinforcing its commitment to long-term dividend growth.
If you’re looking for a growth-oriented dividend payer with a strong brand and global ambitions, this one deserves a place on your radar.
How This Wellness Machine Works
Jamieson Wellness (JWEL.TO) operates a dual-segment model that balances brand strength with manufacturing scale. Its flagship Jamieson Brands division—representing roughly 85% of total revenue—includes its well-known vitamins, minerals, and supplements sold across Canada and over 50 international markets. This segment is the engine of the company: strong brand trust, high margins, and expanding global distribution.
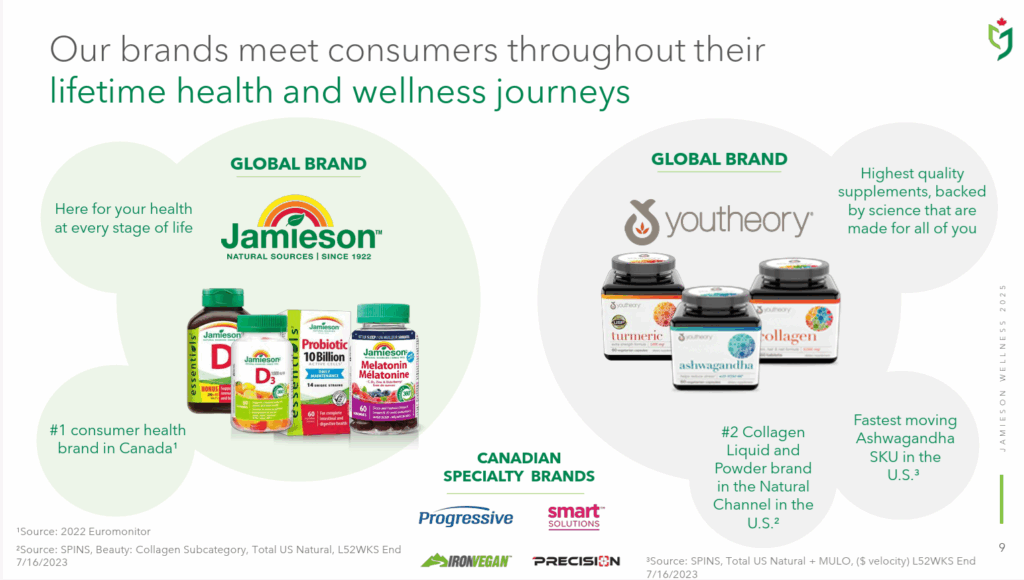
The Strategic Partners segment handles contract manufacturing for third parties. This adds volume, improves capacity utilization in its Canadian and U.S. facilities, and provides revenue diversification. While lower-margin, it supports the company’s manufacturing scale and helps spread fixed costs across more units.
Across both segments, Jamieson sells everything from multivitamins to immunity blends, sports nutrition, probiotics, and beauty-from-within products. Formats range from gummies to chewables to powders, keeping the portfolio modern and competitive with global players.
Why This Brand Has Staying Power
Jamieson has carved out a rare position in Canadian markets: a trusted consumer brand with accelerating international growth. For investors, this translates into a company that combines steady domestic demand with high-growth expansion abroad—especially in China and the U.S.
When the Formula Really Works
Jamieson’s biggest advantage is its brand equity, built over nearly a century and reinforced through quality-first marketing. This brand trust gives the company pricing power, especially in Canada where it dominates shelf space. Internationally, momentum is building quickly. China—where the wellness category is booming—delivered over 60% growth last quarter due to strong digital marketing and improved e-commerce presence. The company’s U.S. brand, Youtheory, also posted double-digit growth.
Another compelling part of the story is consistent top-line growth, typically in the high single digits to low double digits. Management is reinvesting heavily in marketing and distribution, which has temporarily compressed margins. But for long-term investors, this is exactly the type of reinvestment you want to see during a global expansion cycle.
Finally, the recent valuation reset has brought Jamieson back into a reasonable range for investors who prefer growth at a fair price rather than chasing momentum at the top.
Where the Formula Can Break Down
Jamieson’s EPS track record has not been as smooth as its revenue. Margin pressure, driven by reinvestment and cost inflation, has kept earnings growth uneven. Management’s 2025 EPS guidance sits below analyst expectations, reflecting near-term pressure.
The company also operates in a heavily regulated industry. Changes in labeling rules, product categories, or natural health product regulations can create temporary disruptions. International markets add further risk through foreign exchange volatility and evolving regulatory frameworks.
While the brand is dominant in Canada, Jamieson faces tough competition abroad from global giants like Haleon, Kenvue, and Glanbia. Winning shelf space, protecting margins, and maintaining product trust in new regions will require continuous investment and flawless execution.
Latest News: A Quarter Driven by Global Growth
On November 19, 2025, Jamieson delivered a strong quarter with revenue up 13% and EPS up 11%, driven by powerful momentum in its branded segment.
Key highlights:
- Jamieson Brands +16.5%, led by strong performance across Canada, China, and international markets
- Canada +4%, supported by effective marketing and product innovation
- China +63%, thanks to stronger digital presence and high-performing online campaigns
- Youtheory +16.8% in the U.S. via e-commerce and retail expansion
- International markets +19.3%
- Strategic Partners -11.2%, reflecting contract delays due to trade and tariff volatility
Overall, the branded business continues to carry the story.
The Dividend Triangle in Action: Growth with a Long Runway
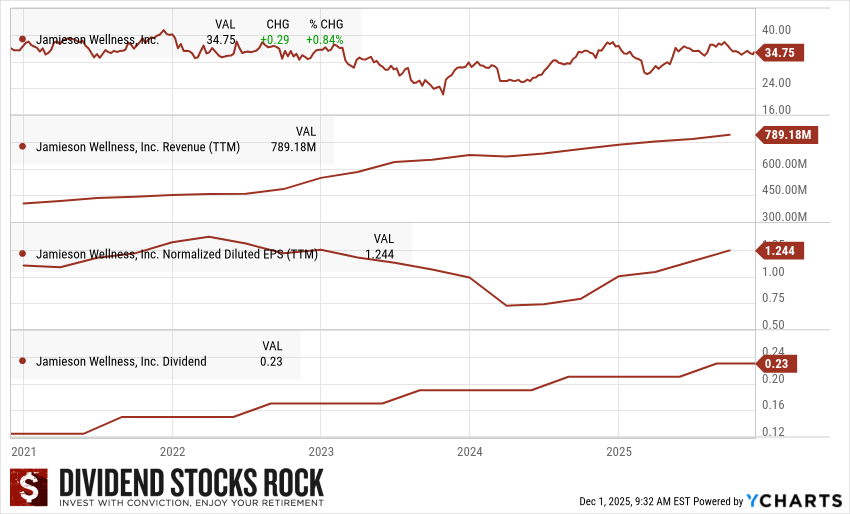
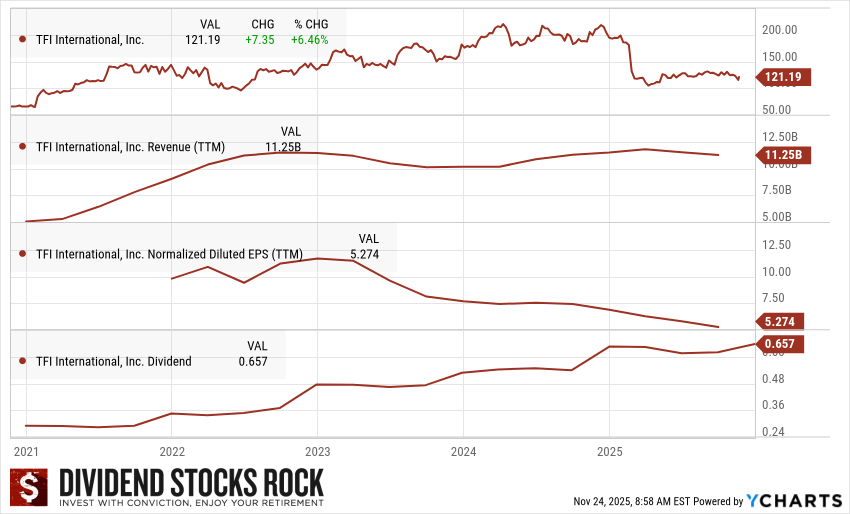
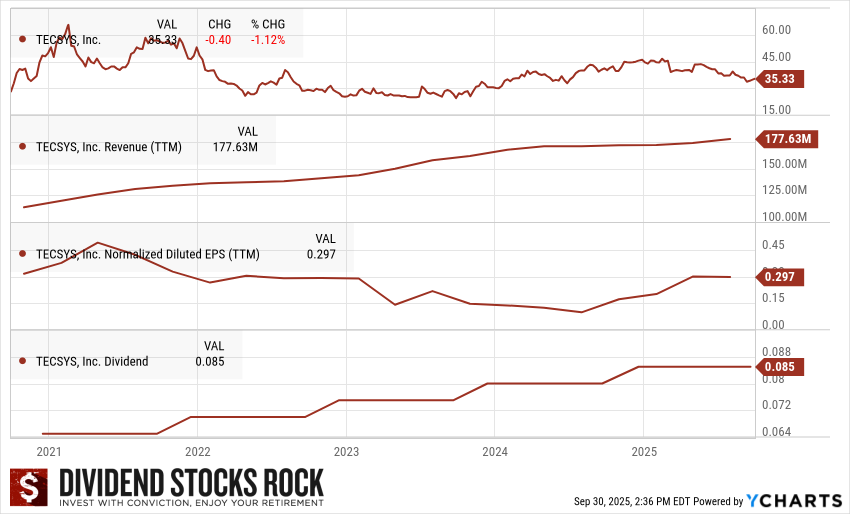
Jamieson’s dividend triangle tells the story of a company in expansion mode, not a mature slow-growth payer.
Revenue:
Revenue has grown steadily and at an impressive pace, reflecting strong domestic demand and accelerating international expansion.
Earnings per Share:
EPS has been bumpier, but the long-term trend is upward as investments begin converting into higher-margin branded sales.
Dividend:
The dividend continues to grow responsibly, supported by solid cash flow generation and the company’s commitment to maintaining its Dividend Aristocrat status.
Final Thoughts: A Growth-Oriented Dividend Payer Worth Watching
Jamieson is not your traditional defensive health stock—nor is it a commodity-based value play. It sits at the intersection of brand strength, global expansion, and health/wellness tailwinds. Short-term margin noise may keep the stock volatile, but long-term investors willing to ride the expansion curve could be well rewarded.
If you’re building a dividend portfolio with a bit of growth punch, this is one of the few small caps in Canada worth following closely.
Your Next Step: Get the Dividend Rock Star List
If you’re looking for high-quality dividend growers with proven business models and strong track records, make sure you download the Dividend Rock Star List—your shortcut to f

iltering out the noise and focusing on the best stocks available in Canada and the U.S.
👉 Get the Dividend Rock Star List here.