Think all Canadian banks are the same? Think again.
Your choice could mean the difference between market-beating returns and lagging.
A common belief is that all Canadian banks perform similarly because of the country’s strong banking system. Since the 2008 financial crisis, each member of the Big Six (Royal Bank, TD Bank, ScotiaBank, BMO, CIBC, and National Bank) has taken a different path.
They all benefited from the banking oligopoly in Canada to fund new growth vectors. Fifteen years later, picking the wrong bank will leave much money on the table.
While most have outperformed the Canadian stock market for 5, 10, 15, and probably 25 years, as of March 2025, five of six had outperformed the market, and four also outperformed the ZEB.TO equal weight banks ETF over 10 years.
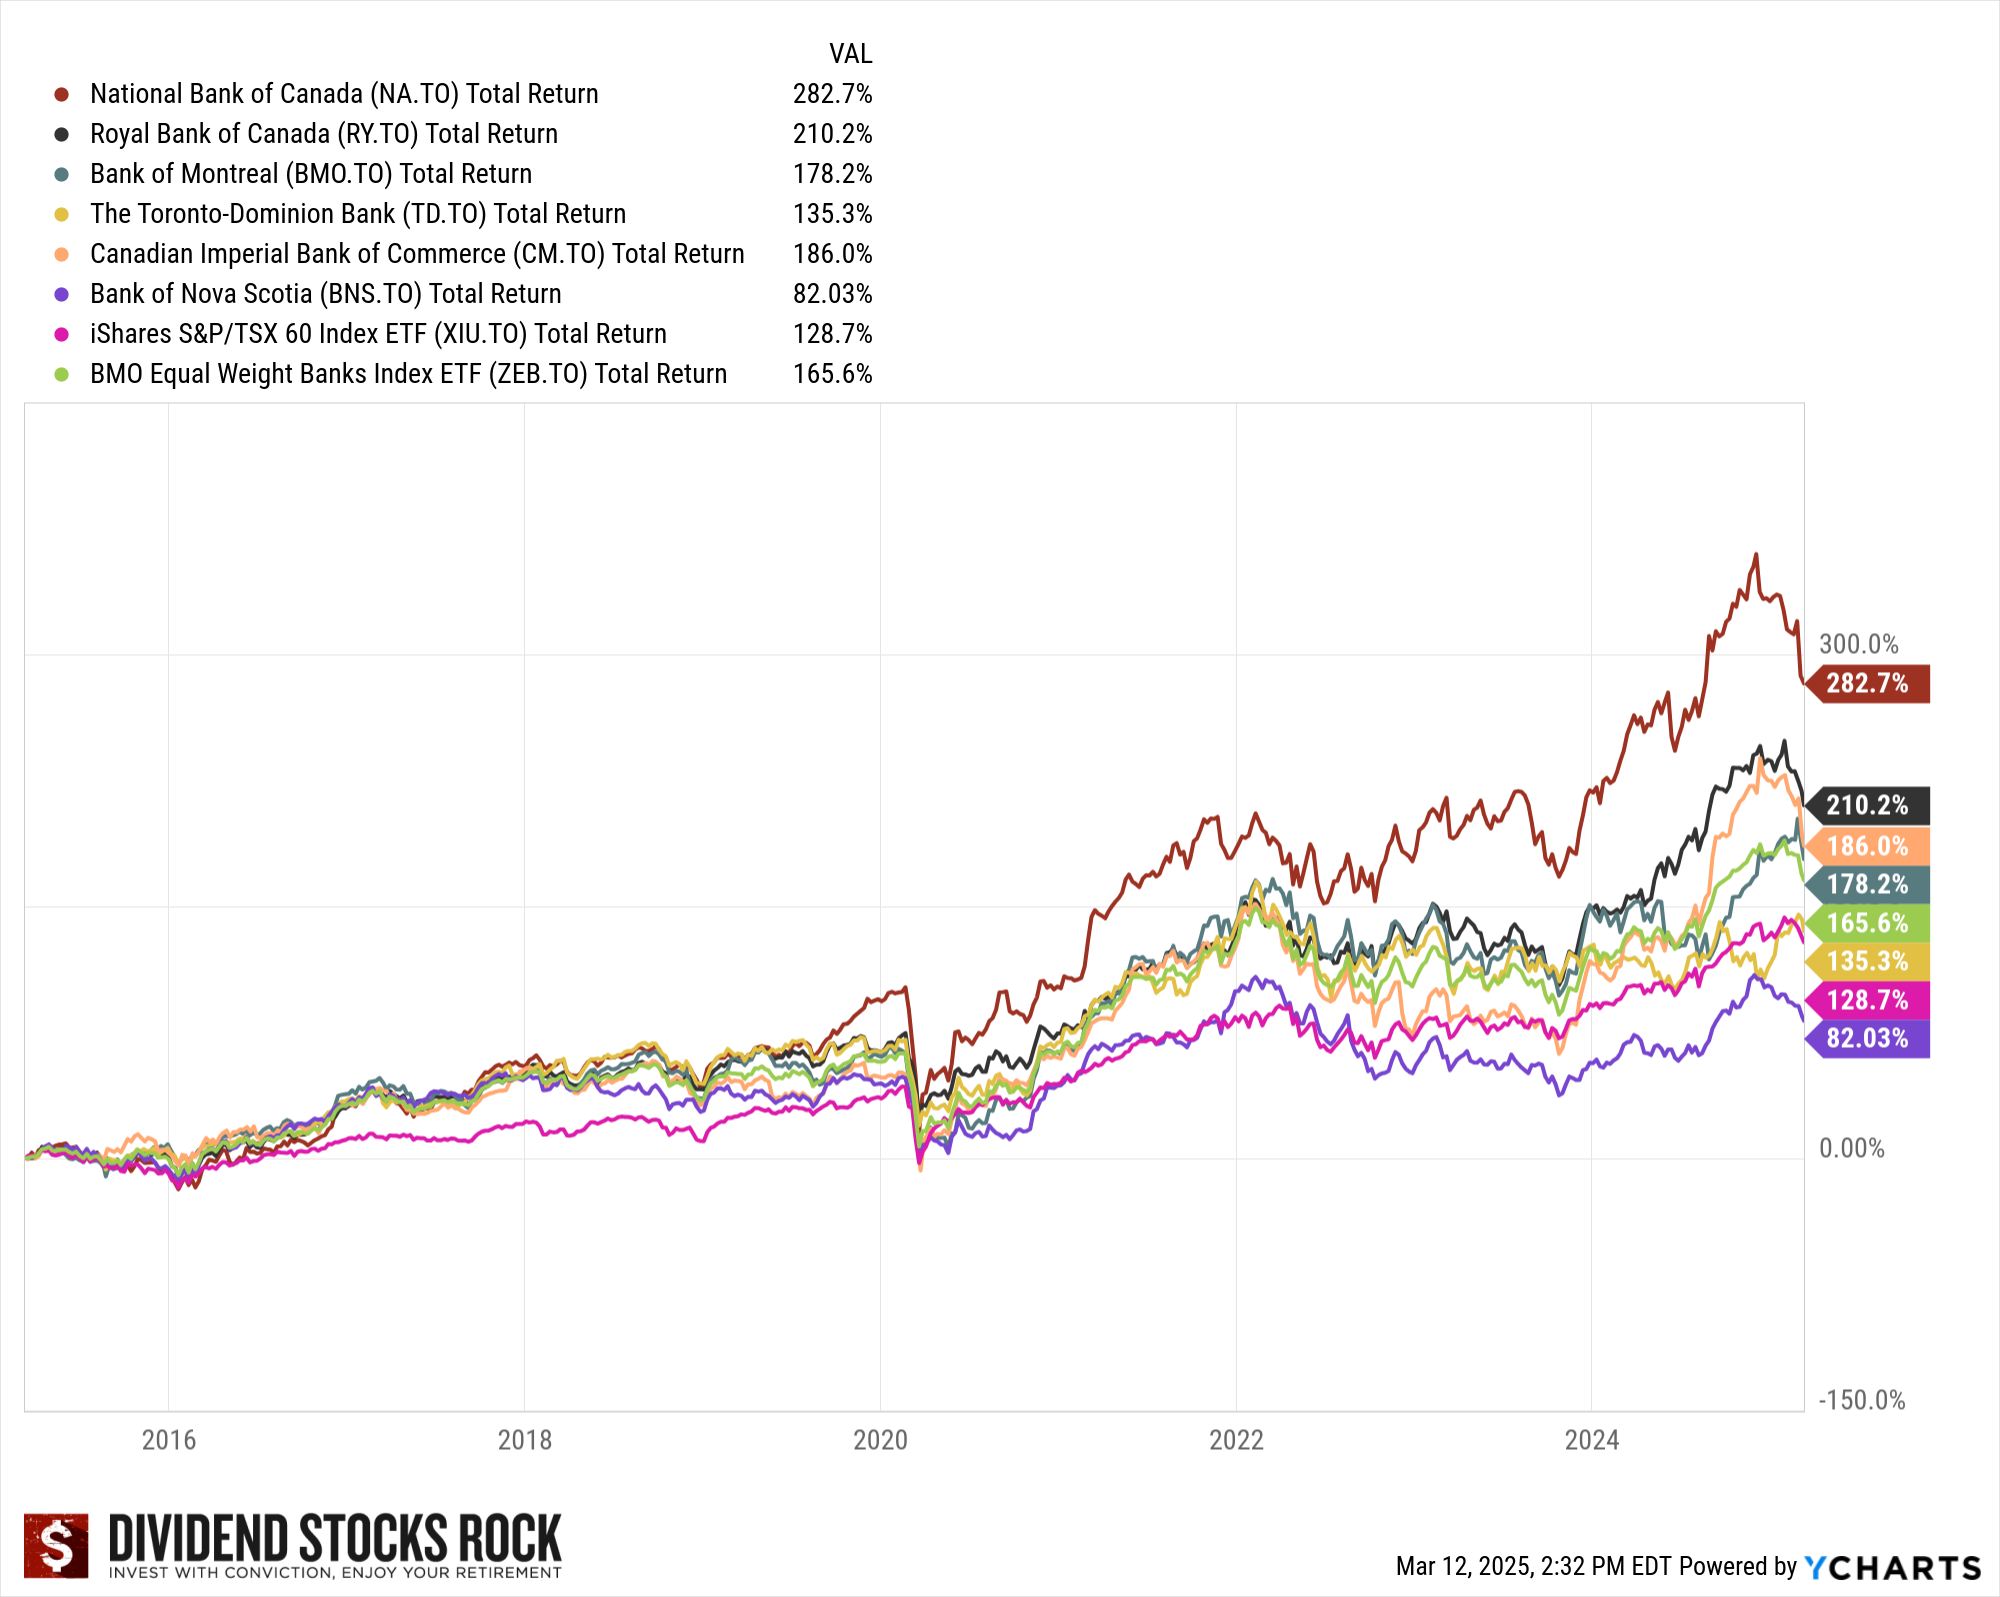
In other words, two are lagging. So which one is best this year and for decades to come?
Canadian Banks Ranking 2025
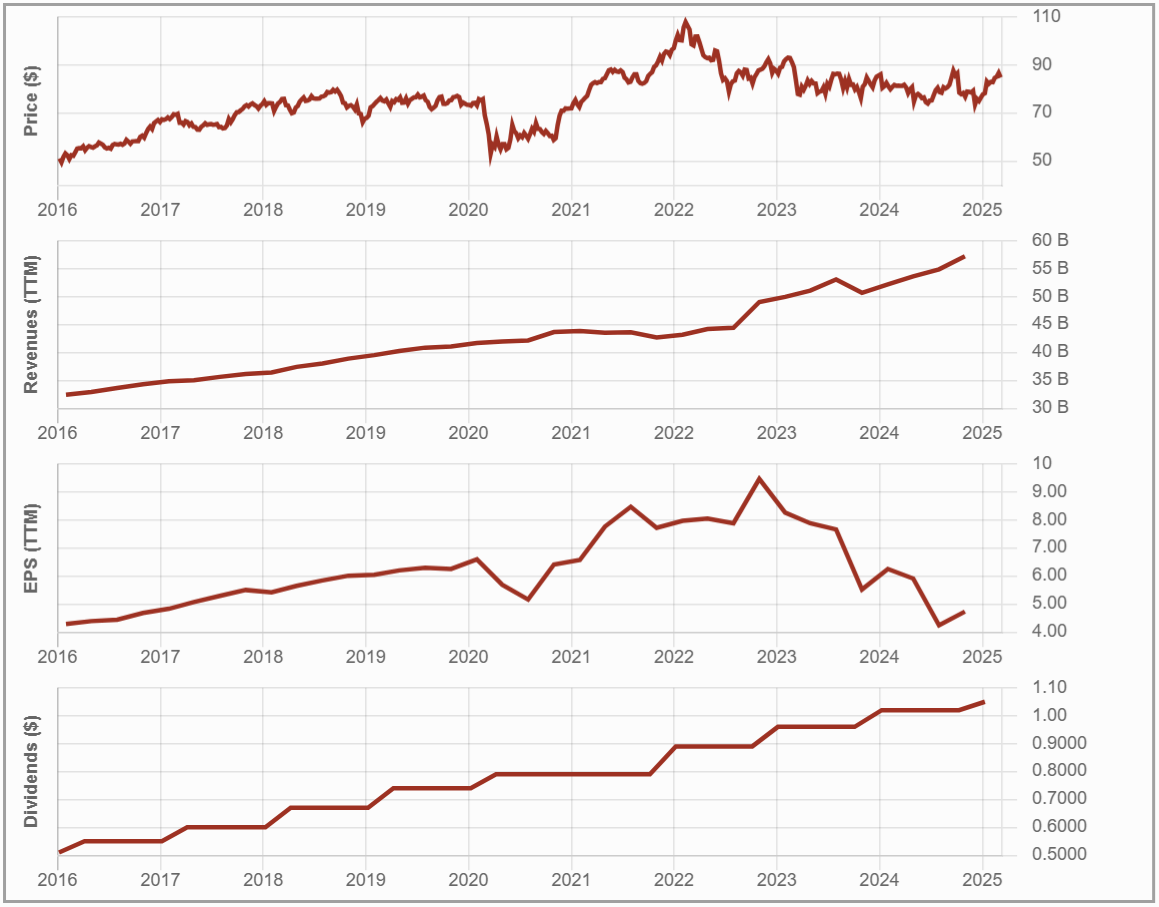
#6 ScotiaBank (BNS.TO)
Investment Thesis: International Edge – A Double-Edged Sword
Scotiabank differentiates itself from Canada’s Big Six banks with its extensive international presence, particularly in Latin America. While this provides higher long-term growth potential, it also introduces volatility and risk.
The bank has streamlined its global footprint, focusing on key markets like Mexico, Peru, and Chile. However, it has consistently struggled to outperform its peers.
Growth will depend on optimizing international operations, expanding wealth management, and navigating economic challenges. While Scotiabank benefits from Canada’s highly regulated banking system, its international moat is narrower than competitors, limiting its pricing power abroad.
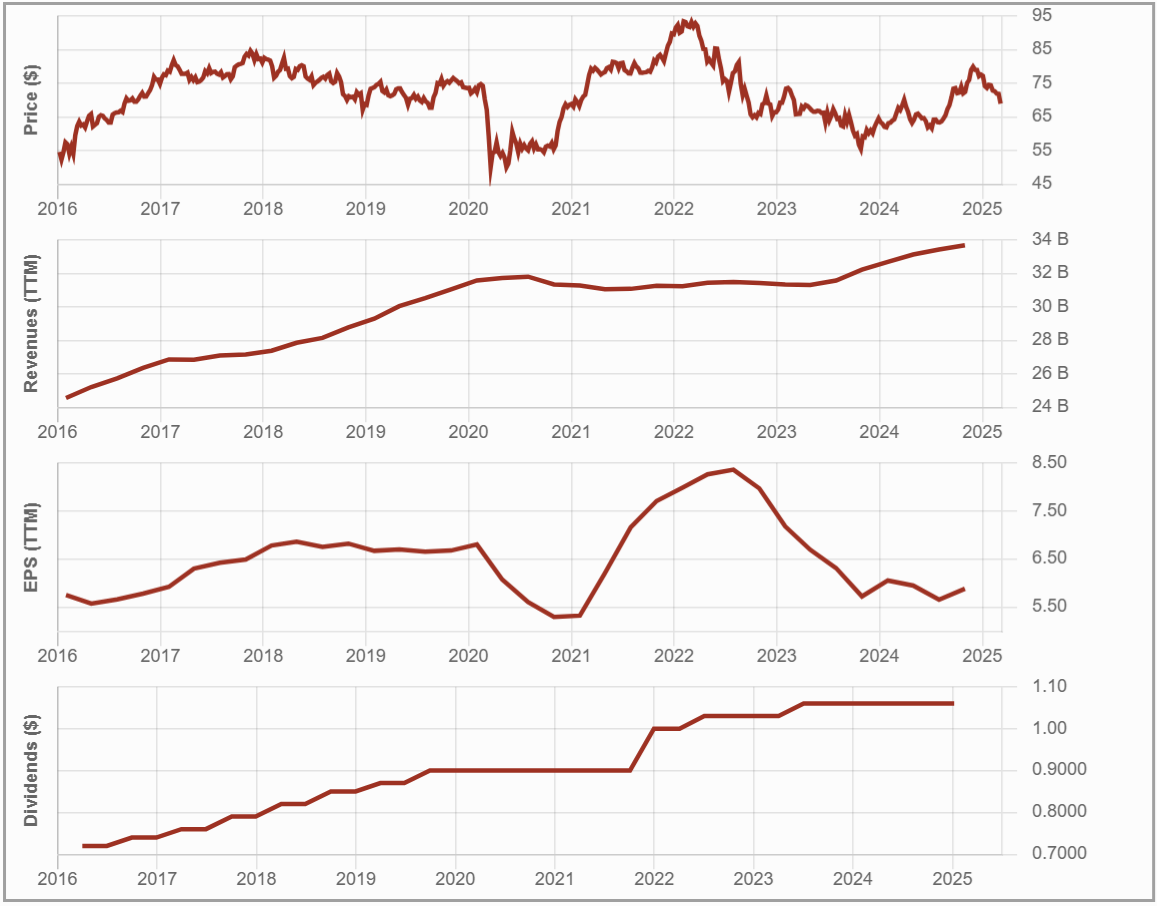
Potential Risks: Volatility Ahead
BNS’s international presence brings unique risks, including exposure to economic downturns, political instability, and currency fluctuations.
The bank has faced rising provisions for credit losses (PCLs), an inefficient cost structure, and challenges in improving profitability.
Domestically, Scotiabank remains vulnerable to a housing market correction and economic slowdown. Broader macroeconomic risks, such as rising interest rates and trade tensions, add further uncertainty. Despite its international reach, Scotiabank has struggled to achieve superior financial performance compared to its peers, lacking dominant market share in key regions and facing stiff competition in wealth management.
The ONLY List Using the Dividend Triangle
After this first example, you may wonder how I was able to differentiate these positions.
I analyze companies according to their dividend triangle (revenue, earnings, and dividend growth trends), combined with their business model and growth vectors. While this may seem too simple, two decades of investing have shown me it is reliable.

While many seasoned investors also use these metrics in their analysis, no one has created a list based on them before. This is exactly why I created The Dividend Rock Stars List.
The Rock Stars List isn’t just about yield—it’s built using a multi-step screening process to ensure the highest-quality dividend stocks. You can read more about it or enter your name and email below to get the instant download in your mailbox.
#5 Canadian Imperial Bank of Commerce – CIBC (CM.TO)
Investment Thesis: A Safe Bet or a Slow Grower?
CIBC shows a strong focus on domestic retail and commercial banking.
Unlike peers with extensive international exposure, CIBC has pursued U.S. expansion to diversify its revenue streams, particularly in wealth management. However, integrating private banking remains a challenge.
The bank trades at a discount due to its slower growth trajectory, making it appealing to income-focused investors.
Its digital banking platform, Simplii Financial, presents an opportunity for long-term customer retention, while reliance on mortgage lending poses risks in economic downturns. While benefiting from Canada’s banking oligopoly, CIBC lacks the competitive moat of more diversified peers.
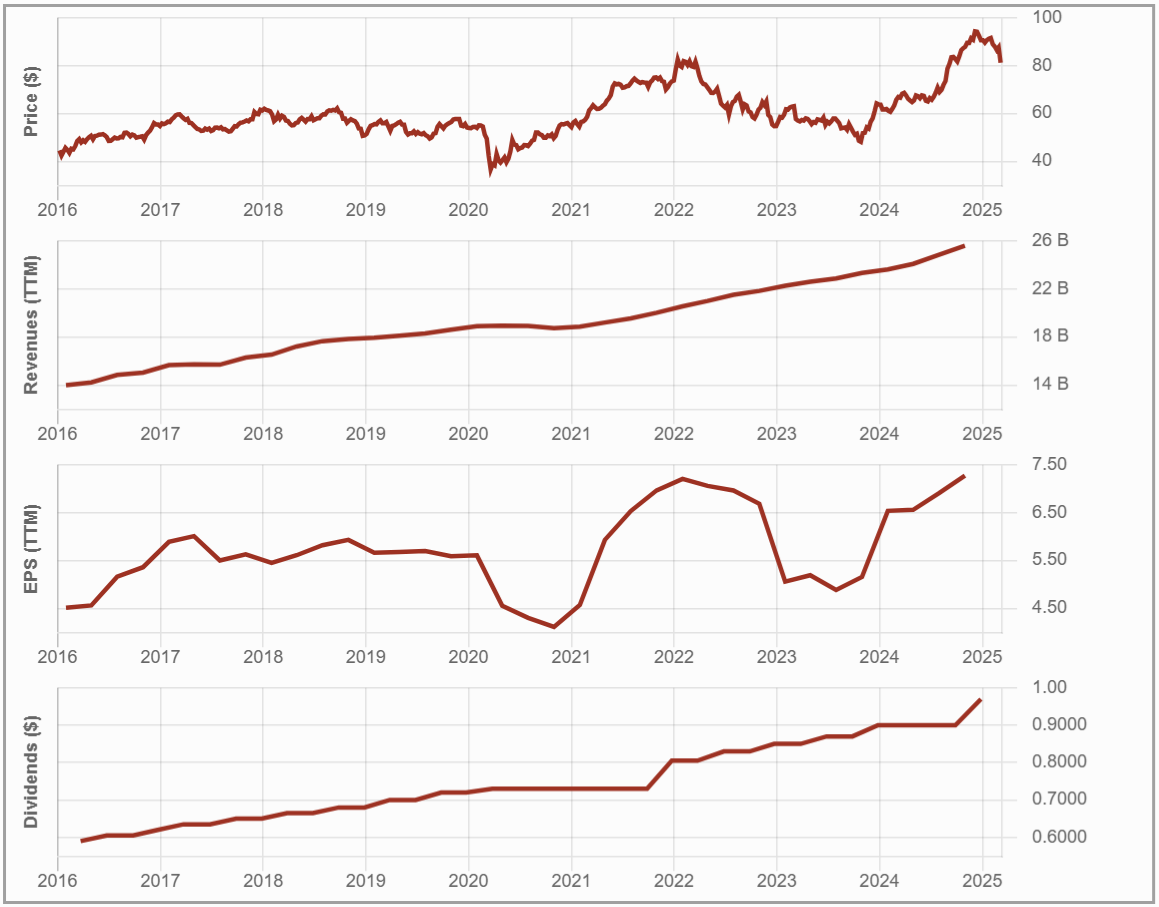
Potential Risks: Too Focused on Canada?
CIBC faces significant risks due to its heavy reliance on the Canadian housing market, making it more vulnerable than its peers to rising interest rates and a potential real estate downturn.
The bank’s high exposure to uninsured mortgages could increase loan loss provisions in an economic slowdown. Its domestic concentration further exposes it to Canadian economic cycles, regulatory changes, and potential recessions.
Among the Big Five, CIBC has underperformed in total returns and future growth expectations, with its strong dividend yield coming at the cost of lower capital appreciation. While its U.S. expansion aims to diversify risk, its mortgage-heavy model remains a key weakness.
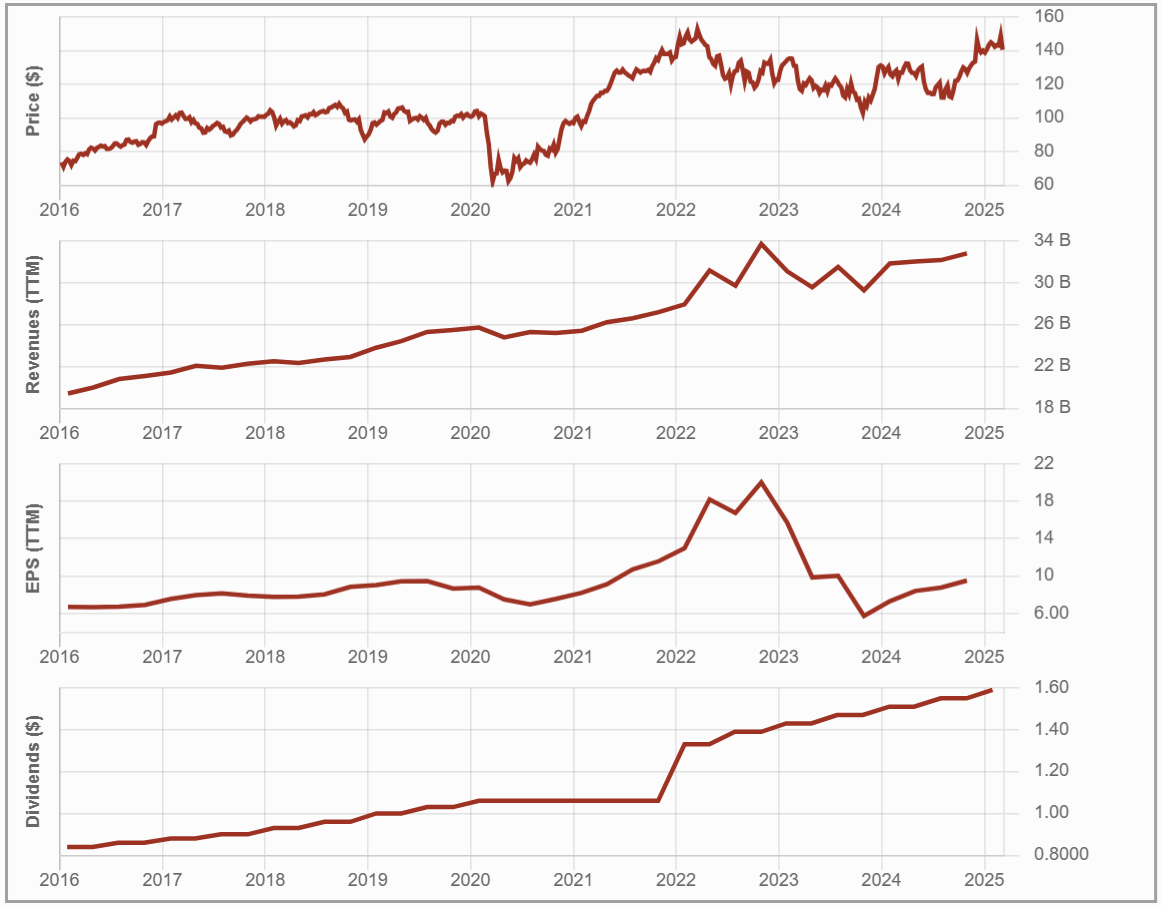
#4 TD Bank (TD.TO)
Investment Thesis: Canada’s Most American Bank
Toronto-Dominion Bank (TD) stands out due to its strong retail banking franchise and significant U.S. presence.
With the largest branch network of any Canadian bank in the U.S., TD has historically relied on acquisitions and organic expansion for growth. However, recent regulatory scrutiny and an anti-money laundering investigation in the U.S. have limited its expansion opportunities.
While TD benefits from a stable Canadian business, rising interest rates present both an opportunity for higher margins and a risk of loan defaults.
Potential Risks: Can TD Overcome Its U.S. Setback?
TD Bank faces mounting risks due to its U.S. anti-money laundering investigation, which led to a multibillion-dollar fine and asset growth restrictions on its U.S. operations.
This directly impacts TD’s long-term expansion strategy, forcing it to shift focus from aggressive growth to regulatory compliance and operational efficiency.
The bank also remains exposed to the Canadian housing market, where rising interest rates could increase mortgage defaults. Broader economic risks add further uncertainty, including trade tariffs and slowing growth.
While TD’s strong brand and market position remain advantages, regulatory constraints could allow competitors to expand more aggressively, putting TD at a disadvantage.
#3 Bank of Montreal – BMO (BMO.TO)
Investment Thesis: Capital Markets, Wealth Management & U.S. Banking
BMO is a diversified financial institution with a strong presence in Canada and the U.S., generating about one-third of its revenue from U.S. operations.
Its strategic expansion, particularly through the 2023 acquisition of Bank of the West, strengthens its cross-border footprint.
BMO has also been a leader in wealth management and ETFs, leveraging these segments for stable fee-based revenue. However, rising provisions for credit losses (PCLs), integration challenges, and exposure to capital markets introduce volatility to its earnings.
Potential Risks: Can It Manage Rising Risks While Competing with Industry Giants?
BMO’s reliance on wealth management and capital markets for growth exposes it to heightened risk, particularly during periods of economic uncertainty.
Rising provisions for credit losses (PCLs) have significantly impacted earnings, partly driven by the challenges of integrating its Bank of the West acquisition.
The bank faces competitive pressures in traditional banking and the ETF space, where BlackRock (BLK) remains a dominant force.
Additionally, macroeconomic headwinds—including trade tensions and potential recession risks—could lead to earnings volatility. While BMO’s U.S. expansion provides diversification, it also increases exposure to higher credit risks compared to more domestically focused Canadian banks.
#2 National Bank (NA.TO)
Investment Thesis: Western Expansion and Global Investments
NA is the most domestically focused of the Big Six banks, with 73% of its revenue generated in Canada, primarily in Quebec.
Its recent $5B acquisition of Canadian Western Bank is set to expand its presence in Western Canada, creating cross-selling opportunities, particularly in private banking.
The bank has also diversified beyond traditional banking, with significant growth in capital markets, wealth management, and international investments, including ABA Bank in Cambodia and Credigy in the U.S.
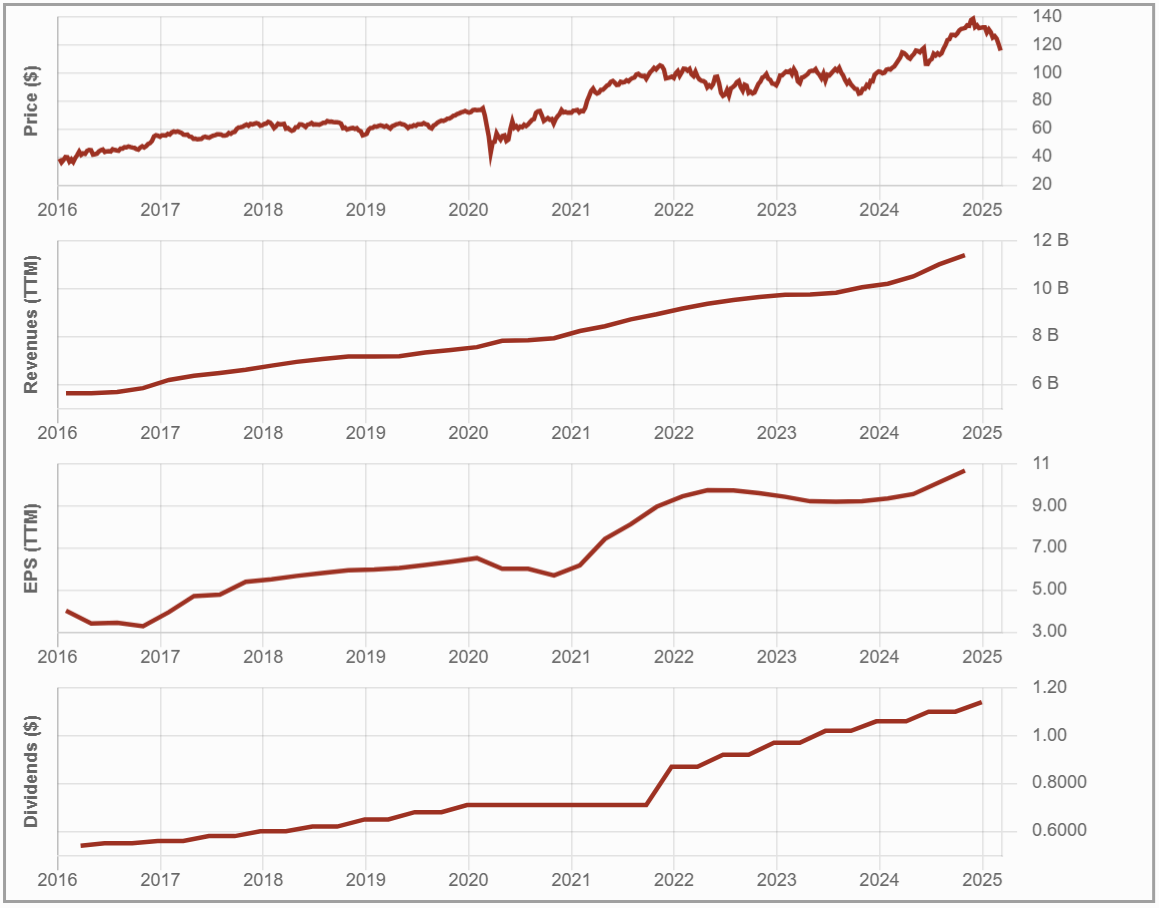
Potential Risks: Growing Challenges
National Bank’s strong performance comes with significant risks, primarily due to its heavy reliance on Quebec, which accounts for about 50% of its revenue. This geographic concentration makes it more vulnerable to regional economic downturns than its larger, more diversified peers.
This also explains why it has fallen second this year, considering the economic uncertainty linked to political tensions between Canada and the U.S.
The bank also takes on higher risk through its international investments in Cambodia (ABA Bank) and alternative lending in the U.S. Rising provisions for credit losses, particularly from ABA Bank, add further uncertainty.
Additionally, its exposure to financial markets introduces earnings volatility, while its smaller scale puts it at a competitive disadvantage against Canada’s largest banks.
I discussed NA’s current challenges in more depth in the Q1-2025 earnings review video. You can then fully grasp why it now holds the second position while remaining one of the best banks for investors.
#1 Royal Bank – RBC (RY.TO)
Investment Thesis: Built for Global Growth
RBC is the largest Canadian bank by market capitalization, with a well-diversified revenue model spanning personal and commercial banking, wealth management, insurance, and capital markets.
Over 50% of its revenue now comes from insurance, wealth management, and capital markets, reducing dependence on traditional banking. RBC’s focus on expanding these segments post-2008 has positioned it well for stable cash flows, market-driven profitability, and global growth.
While Canadian banking regulations create high barriers to entry, RBC’s strong international presence enhances its resilience. Its brand strength, extensive client base, and broad service offerings make it a dominant force in the financial sector.
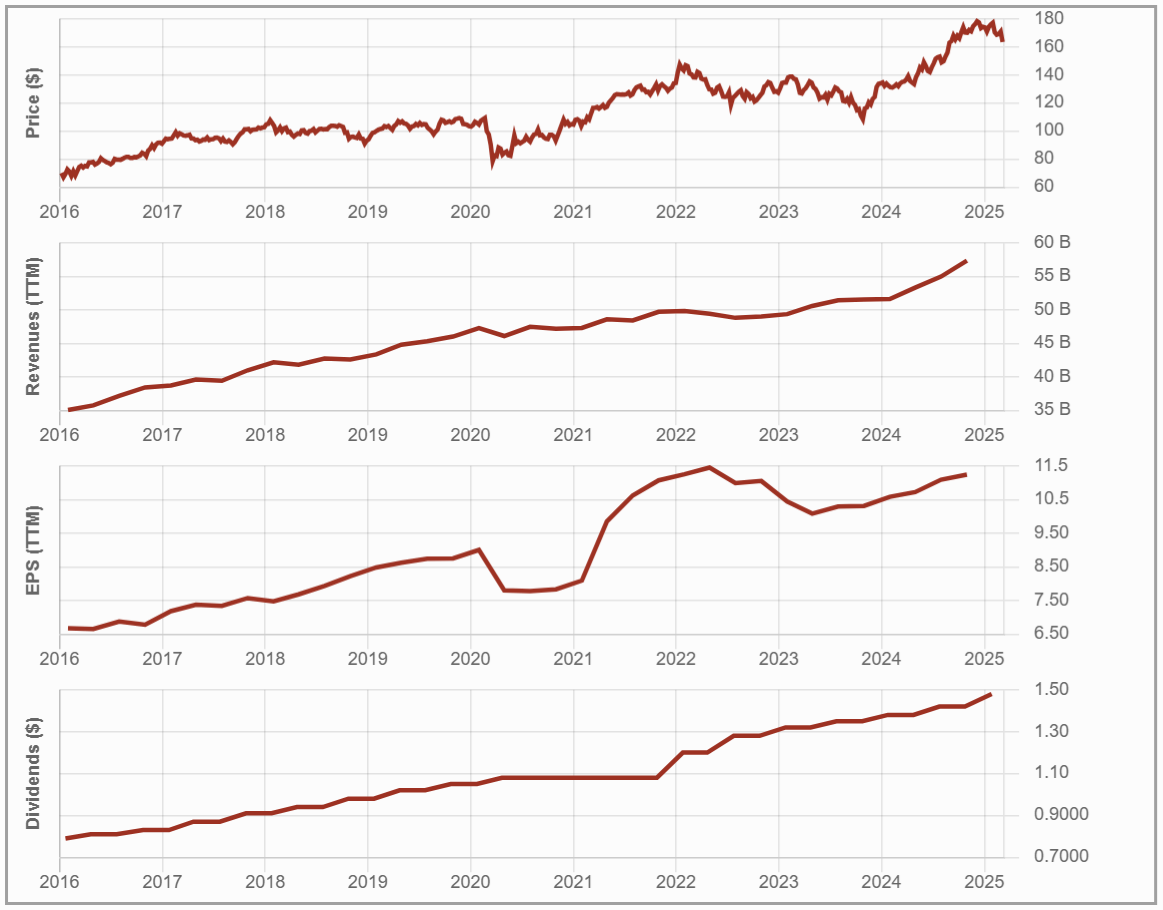
Potential Risks: Housing, Regulation, and Market Volatility
Despite its diversified business model, RBC faces key risks, including exposure to the Canadian housing market, regulatory constraints, and economic downturns, just like any other bank.
Rising interest rates could increase mortgage defaults, impacting its loan portfolio and necessitating higher provisions for credit losses (PCLs).
A potential recession could slow lending activity and increase default rates in both personal and commercial banking. Additionally, regulatory changes could limit profitability, while competition from both domestic banks and global financial institutions pressures RBC to innovate and adapt continuously.
All things considered, it remains the best Canadian Bank option for dividend growth investors.
Find Other High-Quality Stocks: Download the Dividend Rock Stars List
This dividend stock list is updated monthly. You will receive the updated version every month by subscribing to our newsletter. You can download the list by entering your email below.
This isn’t just a list of high-yield stocks—it’s a handpicked selection of Canada’s best dividend growth stocks backed by detailed financial analysis.
✅ Monthly updates
✅ Full dividend safety ratings
✅ 10+ Metrics with filters
Enter your email to get the latest Canadian Dividend Rock Stars List now!
Final Thoughts: Don’t Overdo It!
I’m a foodie, and I love cooking. I particularly like adding spices to get the right taste in a good recipe.
But one thing I don’t do when I cook is to open my cabinet and select sea salt, pink salt, lava salt, Kosher salt, Celtic salt, smoked salt, and a pinch of Fleur de Sel all for the same recipe.
You probably know why, as the taste would very likely be disgusting.
Like seasoning in a meal, a little exposure to Canadian banks can enhance your portfolio. But overdoing it? That could leave a bad aftertaste. Choose wisely.