I used to think that dividend stocks with a yield lower than 3% were worthless. Two decades of investing proved me wrong!
The Canadian Rock Stars List is a selection of the safest dividend stocks in Canada, identified through a rigorous screening process.
Unlike traditional high-yield lists, this selection combines dividend growth, financial strength, and credit stability to determine the best long-term holdings for investors seeking both income and growth.
Dividend Growth Investing = Safe Investing, More Money, Less Stress
“When you have confidence, you can have a lot of fun. And when you have fun, you can do amazing things.”
~Joe Namath
My entire portfolio is invested in dividend growth stocks.
Some holdings act as fixed income, offering a stable dividend yield and being able to weather market storms. Some others are my growth equity, providing lower yields but strong dividend growth and stock price appreciation potential.
Combining various dividend growers will create a balance where your portfolio will help you retire stress-free.
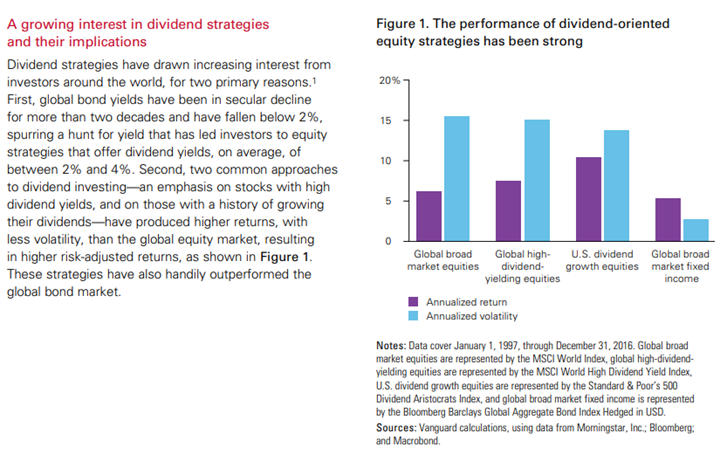
Even Vanguard—a pioneer in ETF investing—conducted studies on recent market history and concluded that dividend growers are among the best-performing assets.

According to Vanguard’s study over these 20 years, dividend growth stocks not only beat the market, but they did it with less volatility.
While dividend growers usually give investors less volatility, you will still go through challenging periods where your favorite holdings will show red numbers. This is where you may start losing confidence and wondering if it would be appropriate to cash your profits and protect your capital.
The Ultimate Safe List to Get Dividend Growth Stock Ideas
To help you build a solid portfolio with dividend growth stocks, I have created the Canadian Rock Stars List, showing about 300 companies with growing trends.
You can read on to understand how it is built and why it’s the ultimate list for Canadian dividend investors, or you can skip to the good stuff and enter your name and email below to get the instant download in your mailbox.
How Has the Canadian Rock Stars List been Built?
This Canadian dividend stocks list has been created with the help of our investment membership; Dividend Stocks Rock. The market will keep throwing you curveballs, so let’s make sure you don’t whiff on them.
We have a clear strategy: we focus on dividend growth stocks.
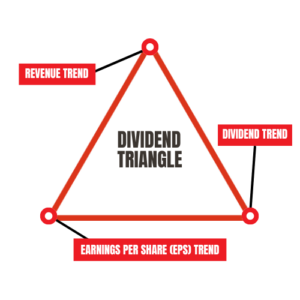
We handpick companies showing a strong dividend triangle (revenue, earnings, and dividend growth trends) and make sure we understand their business model. Since our model is easy to understand and we know why we use it, we never doubt ourselves.
The Rock Stars List isn’t just about yield—it’s built using a multi-step screening process to ensure the highest-quality dividend stocks.
Here’s how we select the best Canadian dividend stocks:
- Revenue & Earnings Growth—Minimum 1% annualized growth over 5 years (adjusted for market cycles).
- Dividend Growth—Minimum 5% annual dividend growth over 5 years.
- Financial Strength—We use Refinitiv’s StarMine Credit Score to assess a company’s ability to handle debt and maintain dividends. It ranks a company’s 1-year default probability from 1-100, with higher scores indicating lower bankruptcy risk.
- Value Analysis—We integrate the StarMine Value Score and analyze six valuation metrics to avoid overpaying. It ranks stocks (1-100) based on their valuation, with higher scores indicating better value. It evaluates six key metrics: EV/Sales, EV/EBITDA, P/E, Price/Cash Flow, Price/Book, and Dividend Yield.
- ESG Considerations—The Refinitiv ESG Combined Score evaluates a company’s Environmental, Social, and Governance (ESG) performance, factoring in reported data and controversies. A higher score (1-100) indicates more substantial corporate responsibility, while legal or ethical issues can lower a company’s rating.
It’s a stronger list than the dividend aristocrats, as we combine various metrics on top of dividend growth.
By filtering the market to find Canadian stocks showing growing sales, earnings, and dividends, we are convinced we can pick among the best Canadian dividend stocks, period.
The Dividend Triangle is key to identifying safe Canadian stocks
With a smart combination of three metrics, you’ll be able to pick the best stocks from our list. You can quickly identify safe investments using the dividend triangle:
Revenues
A business is not a business without revenues.
What is the difference between a company with growing revenues versus a company showing stagnating results? Companies with several growth vectors will ensure consistent sales increases year after year. I’m a big believer in “offense is the best defense.” Whenever we are about to face a recession, I want to make sure I have companies that have shown past revenue growth.
This is an excellent indicator that their business model is doing well and that they won’t enter a recession in a position of weakness.

Earnings
You cannot pay dividends if you don’t earn money.
Then again, this is a straightforward statement. Still, if earnings don’t grow strongly, there is no point in thinking that the dividend payment will increase indefinitely. Keep in mind that the EPS is based on a GAAP calculation. This makes EPS imperfect, as accounting principles are not aligned with cash flow.
This means you are better off looking at the EPS trend over 3, 5, and 10 years. Use an adjusted EPS that discounts those one-time events revealed by the company to have a clear view of what is happening. Some companies could “play around” with earnings for a year or two, but you can’t create a trend out of thin air.
Dividends
Finally, dividend payments are the *obvious* backbone of any dividend growth investing strategy. But I don’t focus on the actual dollar amounts or the yields because we focus solely on dividend growth.
Dividend growers show confidence in their business model.
This is a statement claiming that the company has enough money to grow its business and reward shareholders simultaneously. It also tells you that the business can pay off its financial obligations and invest in new projects (CAPEX). No management team will increase its dividend if it lacks the cash to run its business.
The Dividend Rock Stars List: The ONLY List Using the Dividend Triangle
 The dividend triangle is an exclusive concept developed at Dividend Stocks Rock (DSR).
While many seasoned investors use these metrics in their analysis, no one has created a list based on them before.
Don’t waste any more time with complex strategies and dozens of metrics duplicating each other: focus on quality and download the list with filters now.
What Does a Strong Dividend Triangle Look Like?
Putting those metrics into a stock screener is one thing, but knowing what to do with them is another.
The problem with a simple stock screener is that it will give me the 3-year or 5-year annualized growth, but I can’t see the trend.
A strong Dividend Triangle should show steady revenue, earnings, and dividend growth over time. The trend over the past five years for each metric is long enough to show the current tendency and highlight some jumps or drops I must investigate.
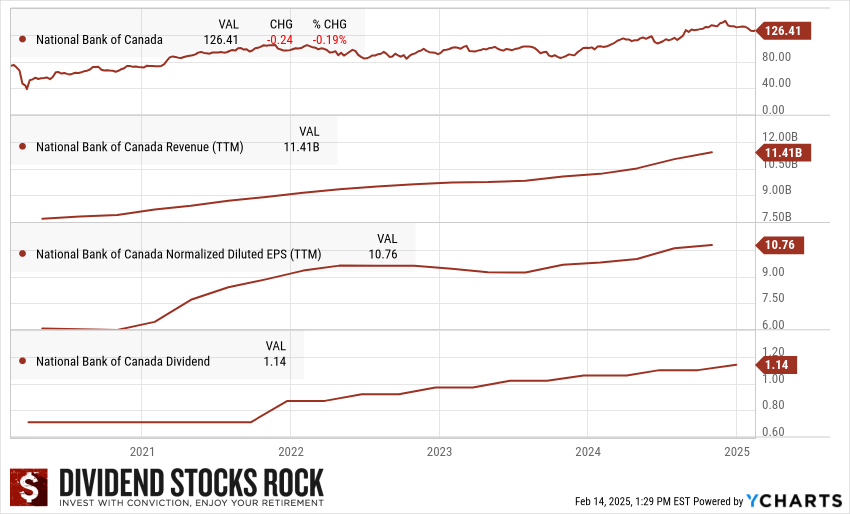
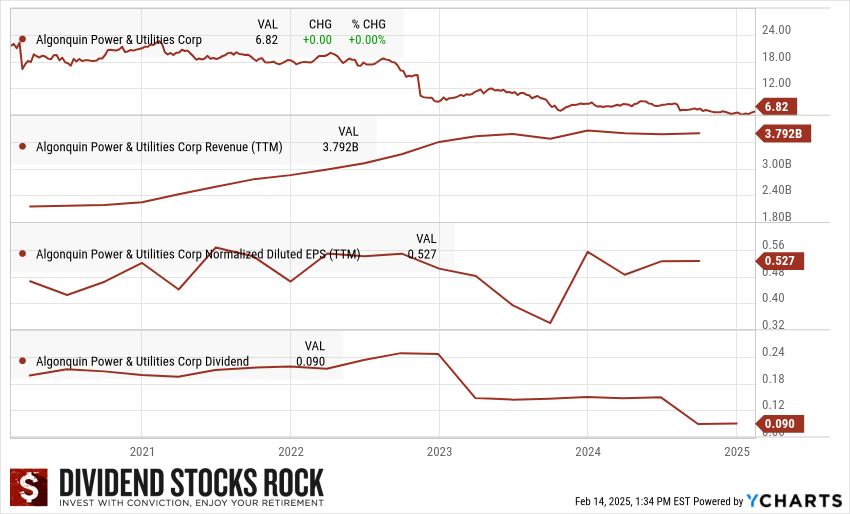
Below is an example of two dividend stocks:
🟢 Strong Dividend Triangle Example (National Bank of Canada – NA.TO)
- Revenue: Consistent annual growth of 5%+
- EPS: Follows revenue growth, ensuring profitability
- Dividend Growth: Resumes steady increases after economic downturns
A decrease in earnings during the pandemic led to a pause (forced by regulators) in dividend growth. Now that the pandemic is behind us, National Bank is back on the Rock Stars list with a strong dividend growth potential.

🔴 Weak Dividend Triangle Example (Algonquin Power & Utilities – AQN.TO)
- Revenue: Inconsistent growth due to high debt and acquisitions
- EPS: Declining due to rising borrowing costs
- Dividend Growth: ❌ Cut after financial struggles in 2022 and again in 2024

Download the Exclusive Dividend Rock Stars List
This Canadian dividend stocks list is updated monthly. You will receive the updated version every month by subscribing to our newsletter. You can download the list by entering your email below.
This isn’t just a list of high-yield stocks—it’s a handpicked selection of Canada’s best dividend growth stocks, backed by detailed financial analysis.
✅ Monthly updates
✅ Full dividend safety ratings
✅ 10+ Metrics with filters
Enter your email to get the latest Canadian Dividend Rock Stars List now!
