Energy stocks are not typically my go-to for a dividend growth portfolio. Their cash flows swing with commodity prices, and dividend cuts can come faster than oil spills when markets turn. Yet, despite that volatility, Canada’s energy sector holds a few bright spots worth a closer look.
Some of these companies have learned to thrive in a world that no longer rewards boom-or-bust cycles. They’ve adapted with stronger balance sheets, better capital discipline, and a growing focus on shareholder returns. Whether through pipelines, oil sands, or industrial equipment, these players demonstrate that dependable cash flow can still be found in the energy patch — if you know where to look.
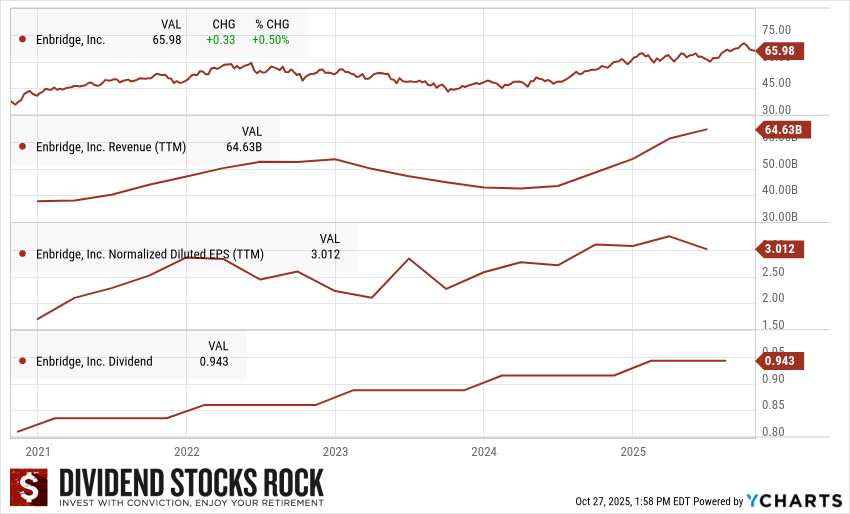
4. Enbridge (ENB.TO)
The Backbone of North American Energy Flow
Investment Thesis
Enbridge isn’t an oil producer — it’s the toll road that energy flows through. Its vast pipeline network transports roughly 70% of Canada’s crude oil and a large portion of its natural gas. Thanks to long-term take-or-pay contracts (many lasting over two decades), Enbridge enjoys a predictable cash flow largely independent of commodity prices.
Following its merger with Spectra Energy, Enbridge expanded into natural gas transmission, which now makes up nearly half of earnings. The company also operates a growing portfolio of renewable energy assets, positioning it to play a role in the energy transition. Management targets 7–9% annual EBITDA growth through 2026, underpinned by recent U.S. gas utility acquisitions.
Potential Risks
Enbridge’s biggest challenge is its balance sheet. With over $100 billion in long-term debt, rising interest rates and regulatory hurdles could strain cash flow. Environmental opposition and project delays remain constant risks. While the company’s infrastructure is essential, its growth runway may narrow without further acquisitions or policy tailwinds.
Unlock More Dividend Growth Picks
If you want more hand-picked dividend growers across industries, grab our Dividend Rock Star List.
It features around 300 stocks with complete Dividend Safety Scores, growth projections, and buy lists tailored for retirement portfolios.
Most importantly, it is the ONLY list using the Dividend Triangle as its foundation.
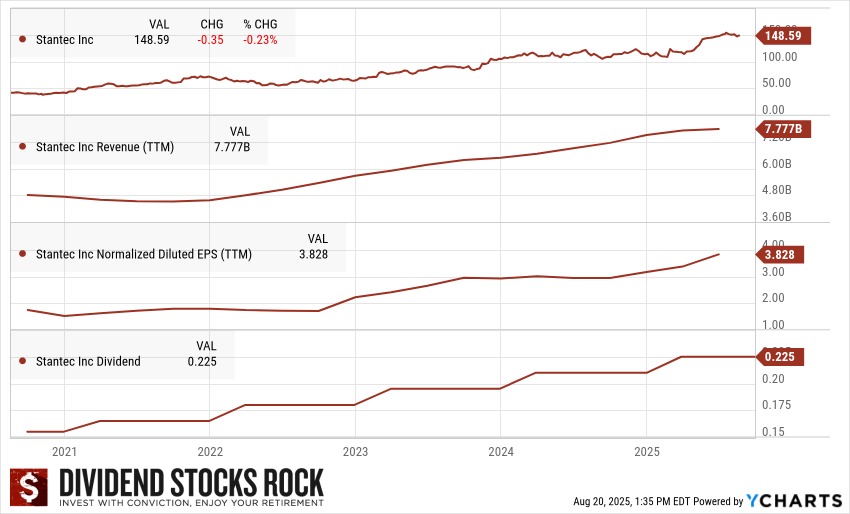
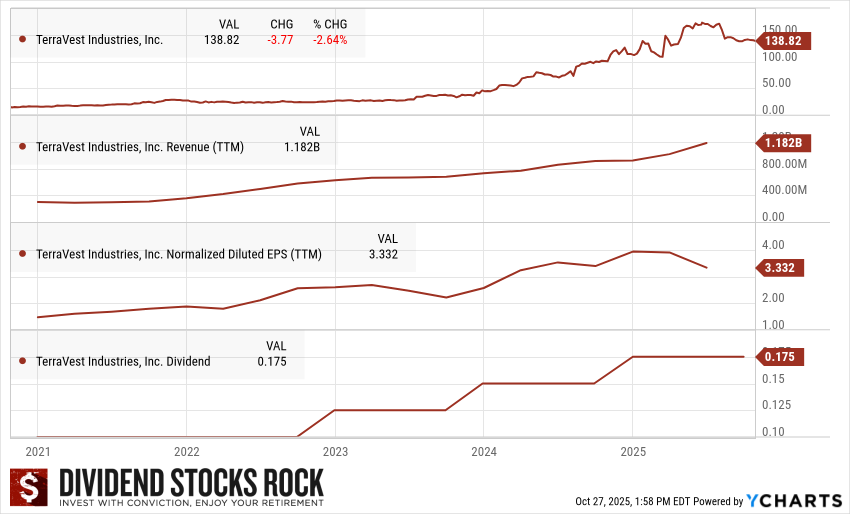
3. TerraVest Industries (TVK.TO)
The Small-Cap Engine Powering Industrial Energy
Investment Thesis
TerraVest is a rare gem among smaller Canadian industrials. The company designs and manufactures specialized equipment for energy, transportation, and infrastructure markets — making it a hybrid between an energy supplier and a diversified manufacturer.
Its growth strategy leans heavily on acquisitions, expanding product lines, and market reach while maintaining disciplined execution. Recent deals like Advance Engineered Products and Highland Tank have boosted both scale and profitability. With recurring demand for essential infrastructure products, TerraVest’s cash flows tend to hold up even when oil prices drop.
Potential Risks
As a small-cap, TerraVest carries more volatility and execution risk. Integration challenges from rapid acquisitions can pressure margins, as seen in 2025 when financing costs weighed on earnings despite strong revenue growth. Investors should expect more fluctuation here than from larger peers.
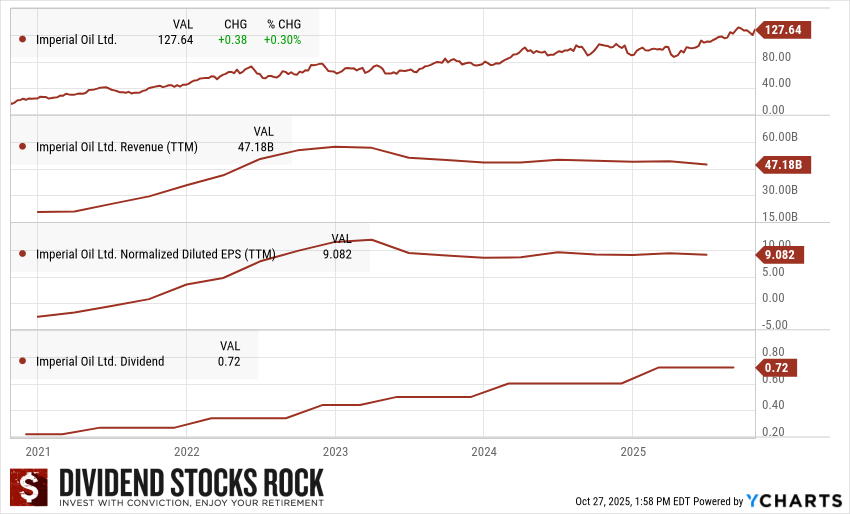
2. Imperial Oil (IMO.TO)
A Steady Hand Backed by Exxon
Investment Thesis
Imperial Oil brings stability to an often-unstable sector. Its vertically integrated structure — spanning upstream, refining, and retail — provides balance across market cycles. With Exxon Mobil as a majority shareholder, Imperial gains access to world-class technology, research, and capital discipline.
Refining operations and over 2,000 Esso-branded stations offer steady cash flow when crude prices slump. Meanwhile, oil sands operations like Kearl and Cold Lake deliver scale and longevity. Recent investments in carbon capture and clean fuel initiatives show Imperial’s pragmatic approach to the energy transition.
Potential Risks
Imperial’s oil sands exposure keeps it tethered to heavy crude prices and environmental scrutiny. Sustained low oil prices would strain its upstream cash flow, while delays in emission-reduction projects could hurt competitiveness.
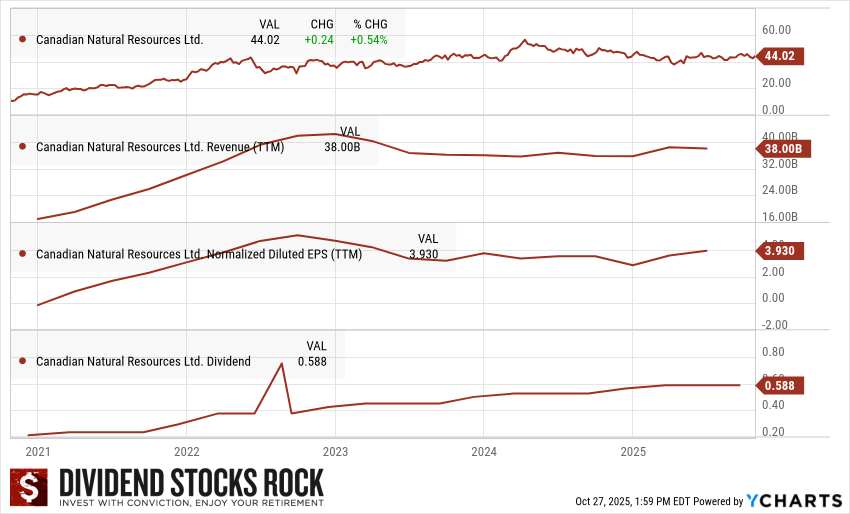
1. Canadian Natural Resources (CNQ.TO)
A Cash Flow Machine in a Cyclical World
Investment Thesis
Canadian Natural Resources (CNQ) stands out as one of Canada’s most disciplined and diversified producers. Its combination of long-life, low-decline oil sands assets and conventional oil and gas operations gives it a unique ability to generate free cash flow even when crude prices weaken. With a breakeven WTI near $35 per barrel, CNQ has consistently outperformed peers during downturns.
The company’s strategy is refreshingly straightforward — produce efficiently, reinvest wisely, and return excess cash to shareholders. In 2025, production is expected to rise 13% year over year, driven by new projects and acquisitions, such as Chevron’s Alberta assets. Management’s proven counter-cyclical approach — investing when others retreat — has paid off in both growth and resilience.
Potential Risks
CNQ’s profitability remains tied to commodity prices. Environmental and regulatory headwinds, particularly in Alberta, could limit expansion or increase compliance costs. Its capital-intensive oil sands operations, while efficient, are exposed to carbon pricing and pipeline constraints that could erode margins.
Balancing Risk and Reward in the Energy Sector
Canadian energy companies have come a long way from their boom-and-bust past. The best names today combine scale, efficiency, and diversification — essential traits for thriving in a decarbonizing world. Still, this remains a cyclical sector, where patience and timing matter.
For dividend investors, the key isn’t chasing the highest yield, but finding sustainable growth supported by operational discipline. CNQ and Imperial deliver that through scale and balance; TerraVest brings agility and niche strength; and Enbridge provides reliable cash flow through its infrastructure dominance.
If you’re looking to add exposure to Canada’s energy sector, these four companies represent the most solid mix of stability, growth potential, and dividend dependability available today. Just remember — even the steadiest oil stock can wobble when prices swing.
Find More Dividend Rock Stars
Want to discover more high-quality dividend growers like these?
Grab your copy of our Dividend Rock Star List, featuring around 300 stocks screened for dividend safety, growth potential, and long-term reliability.
Download your free Dividend Rock Star List here