Canada’s housing market has long been a story of strong population growth, limited supply, and rising rents. For income investors, this creates an appealing setup: residential real estate trusts that generate steady cash flows while riding the structural demand for rental housing. With inflation protection and high occupancy rates, these businesses can provide a dependable stream of dividends even when the broader economy slows.
How the Rent Gets Paid
Canadian Apartment Properties Real Estate Investment Trust (CAPREIT) (CAR.UN.TO) is a Canada-based provider of rental housing. The Company owns and manages interests in multiunit residential rental properties, including apartments, townhomes and manufactured home communities (MHC), principally located in and near urban centers across Canada. The Company owns approximately 45,400 residential apartment suites, townhomes, and manufactured home community sites located across Canada and the Netherlands.
Its objectives are to maintain a focus on maximizing occupancy and responsibly growing occupied average monthly rent (Occupied AMR) in accordance with local conditions in each of its markets; upgrade the quality and diversification of the property portfolio through repositioning and capital recycling initiatives to grow earnings and cash flow potential; and maintain strong financial management and a conservative and well-balanced capital structure to increase FFO per unit, NAV per unit, among others.
Why It Appeals to Income Investors
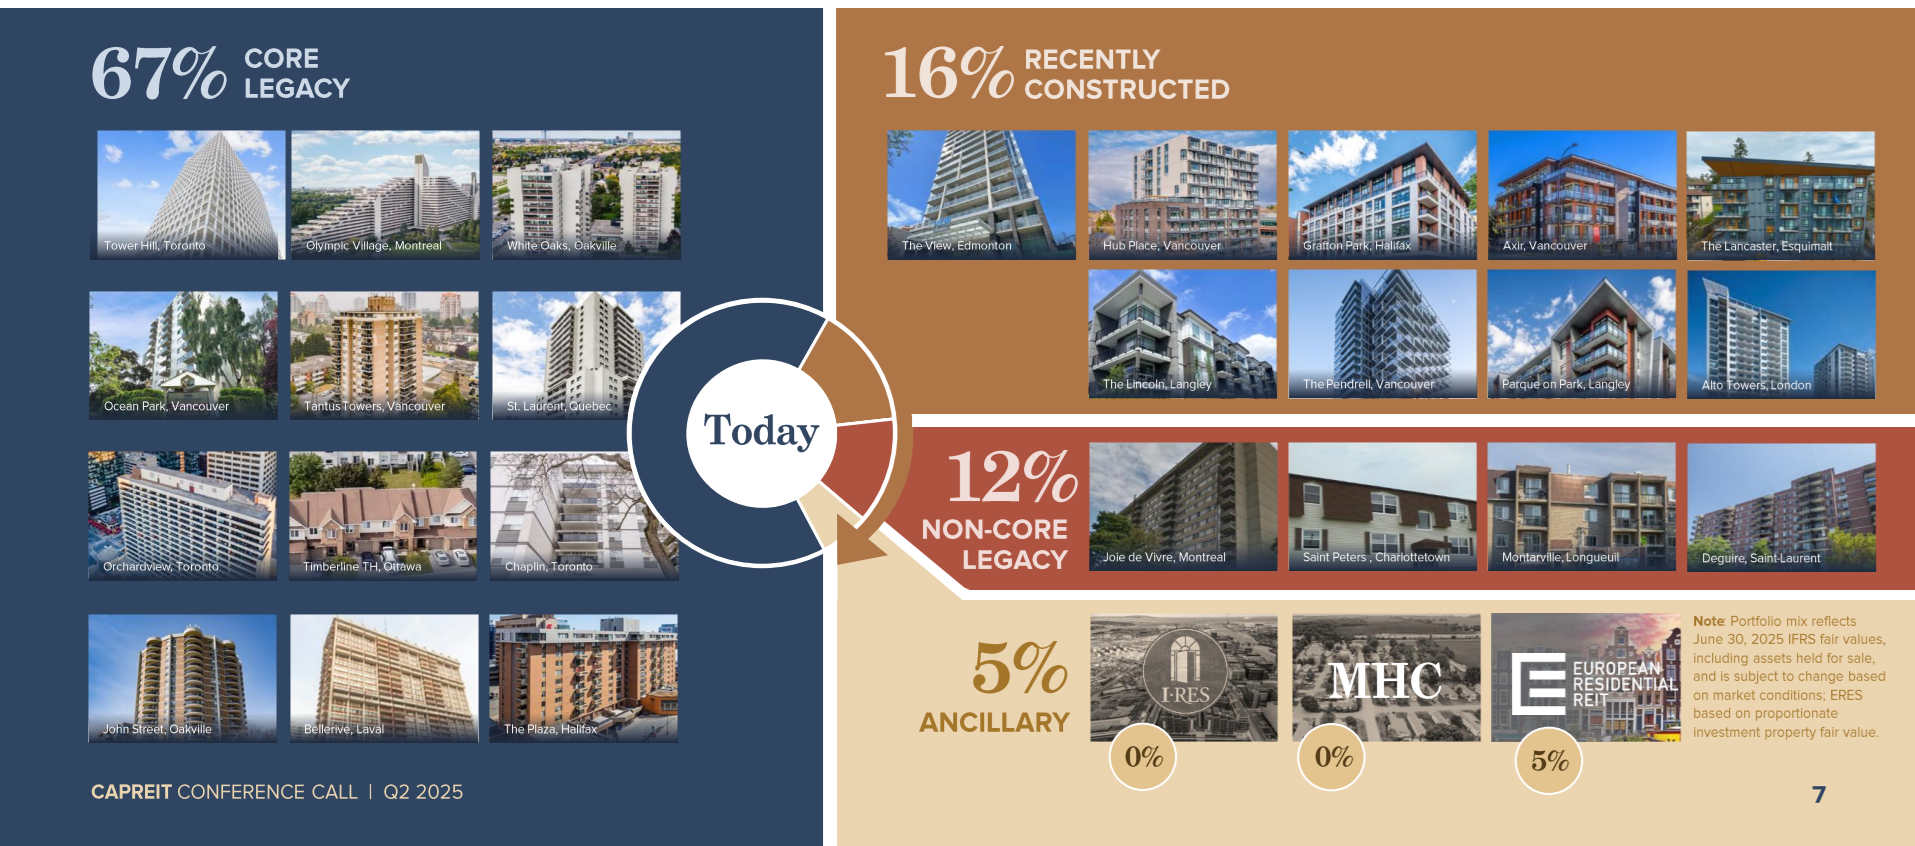
CAPREIT is one of Canada’s largest residential real estate investment trusts, with a portfolio of over 48,000 rental suites and manufactured housing community sites across Canada and the Netherlands. CAPREIT provides investors with a steady source of income and inflation-resistant cash flows. The REIT has demonstrated high single-digit organic growth and has been raising capital to acquire new properties, improving its geographic diversification. In 2024, CAPREIT engaged in significant capital recycling, disposing of nearly one billion dollars in Canadian rental properties while planning additional asset sales in the Netherlands and other regions.
Playbook
CAPREIT generates revenue primarily through rental income from its residential properties, which are mainly located in Canada, with additional exposure in the Netherlands. The company targets stable occupancy rates, with residential occupancy at 98%. The trust benefits from strong demand for rental housing, particularly in high-growth Canadian markets, where rental rates have continued to rise.
Growth Vectors
-
Rental Rate Increases: Rent growth remains a consistent driver, supported by high occupancy and urban demand.
-
Capital Recycling: Nearly $1B in Canadian properties sold in 2024, plus further sales in Europe to reinvest into core markets.
-
Portfolio Upgrades: The REIT continues to enhance property quality and focus on higher-growth urban locations.
Economic Moat
CAPREIT benefits from substantial barriers to entry in the residential rental market, including high property acquisition costs and zoning restrictions. Its scale and geographic diversification provide a competitive edge, allowing the company to optimize property management and rental pricing strategies. However, rising expenses and regulatory challenges in rent-controlled markets could limit its pricing power.
Bull Case – The Upside of Housing Scarcity
CAPREIT offers investors exposure to one of the most resilient segments of the real estate market: rental housing in Canada’s largest urban centers. With nearly 50,000 rental suites and sites, the trust can leverage economies of scale while maintaining occupancy rates near 98%. The strategy of capital recycling—selling lower-growth properties to reinvest in higher-demand locations—has kept the portfolio aligned with long-term market fundamentals.
Disposals in Europe further reduce currency and regulatory risks while sharpening CAPREIT’s focus on Canadian rental demand, which is supported by strong immigration and limited supply. Rent escalations, portfolio upgrades, and disciplined financial management all support reliable FFO growth and, in turn, steady dividend increases.
Bear Case – Cracks Beneath the Surface
The bear case stems from slowing growth and rising costs. Revenue declined 8.5% in the most recent quarter due to portfolio dispositions, and future growth will depend on reinvesting sale proceeds into more productive assets. Repair and maintenance expenses are rising, putting pressure on margins. Additionally, tighter economic conditions or an eventual rebound in housing supply could put rental growth at risk.
Another concern is geographic concentration: while CAPREIT is diversified across Canadian cities, its heavy focus on rental housing ties closely to Canadian economic and regulatory conditions. With rent controls in several provinces, the trust may struggle to fully offset rising expenses through rent increases.
Find More Rock-Solid Dividend Payers
CAPREIT is a good example of how dependable income can come from steady, reliable businesses. But it’s only one name among many. If you want to see the best dividend growers across Canada and the U.S., check out our monthly updated Dividend Rock Star List.
Inside you’ll find:

Over 350 dividend stocks screened with our Dividend Safety Score.
-
The latest valuation metrics to spot bargains vs. traps.
-
Monthly updates so you always have fresh, actionable data.
Whether you’re building a portfolio for income today or growth tomorrow, the Dividend Rock Star List is your shortcut to the most reliable dividend growers.
Get your copy here
What’s New: Capital Recycling Continues
CAPREIT reported a mixed quarter:
-
Revenue: Declined 8.5%, reflecting asset sales in Europe.
-
FFO per unit: Increased 3%, supported by lower interest expense and unit repurchases.
-
Canadian portfolio: Same-property NOI rose 4.9% with occupancy improving to 98.3%.
-
Margins: NOI margin expanded 40 bps to 66.3%, highlighting operational strength despite a smaller portfolio.
The trust remains focused on simplifying its portfolio, reinvesting in Canadian properties, and supporting stable FFO growth.
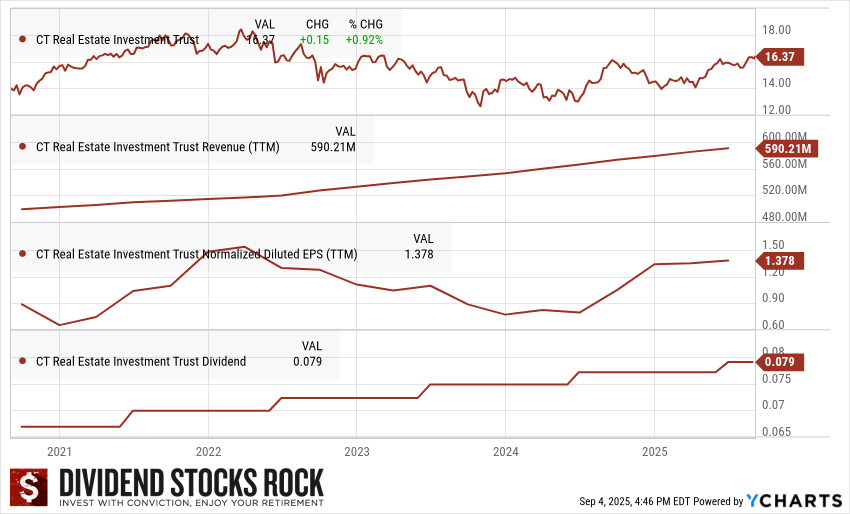
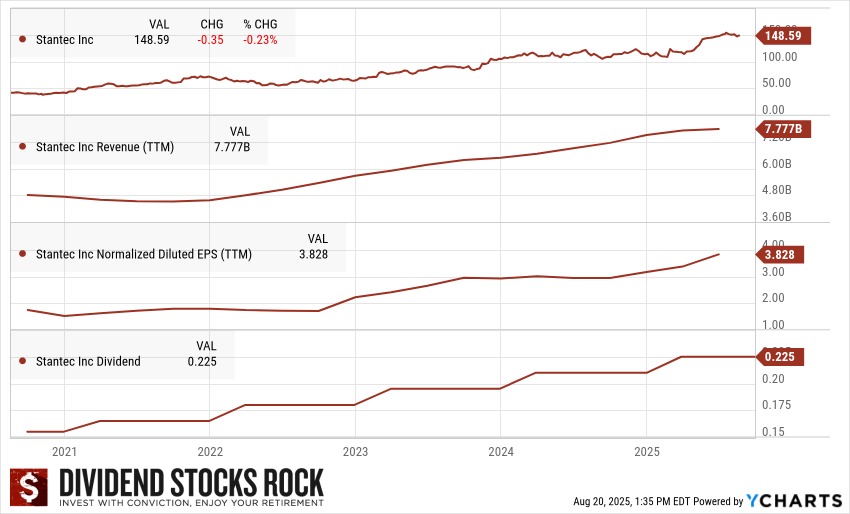
The Dividend Triangle in Action: Still Resilient
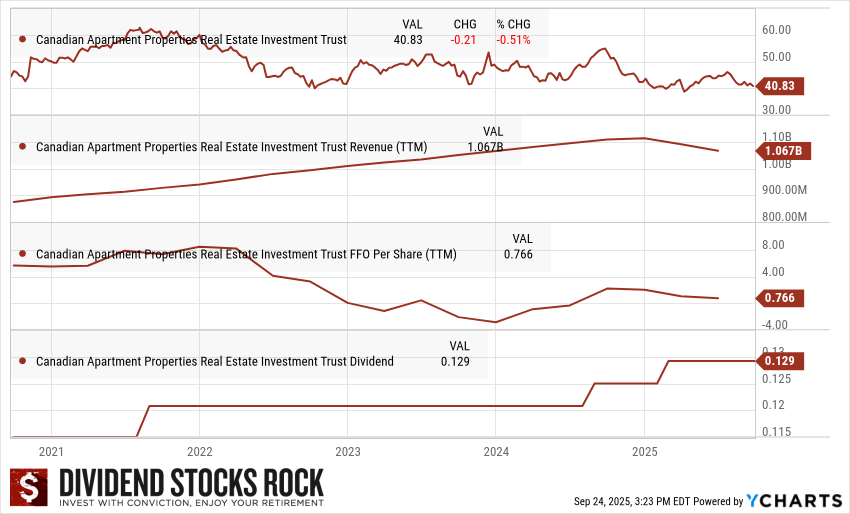
While the growth has been uneven recently due to capital recycling, CAPREIT still shows the qualities of a resilient income vehicle:
-
Revenue: Stable long-term trend, though recent sales temporarily reduced growth.
-
FFO per share: Fluctuating, but supported by high occupancy and reinvestments.
-
Dividend: Slow but steady growth, with management committed to sustainable increases.
Final Thoughts: Balancing Stability with Transition
CAPREIT stands as a reliable play on Canada’s rental housing shortage, but it’s not without challenges. Revenue growth has slowed, and costs are rising, yet its balance sheet, occupancy, and disciplined recycling strategy support long-term income stability. For dividend investors, CAPREIT is less about explosive growth and more about steady cash flow anchored in essential housing demand.
Want more dependable dividend growers ideas?
The Dividend Rock Star List is updated monthly with over 350 screened dividend stocks, complete with safety scores and valuations.