This grocerer isn’t flashy, speculative, or fast-growing — but that’s exactly why it deserves attention. This is a company Canadians interact with constantly, often without stopping to think about the investment behind the groceries, prescriptions, and everyday goods flowing through its network.
In a sector defined by thin margins and relentless competition, Loblaw has built an engine of steady growth through disciplined execution, national scale, and strong private-label brands. It doesn’t have an economic moat, but it does have staying power — and enough diversification to keep earnings climbing even in tougher retail environments.
Below is the full breakdown of the business, what drives its growth, the key risks, and how its dividend triangle stacks up today.
What Powers This Giant: The Business Model
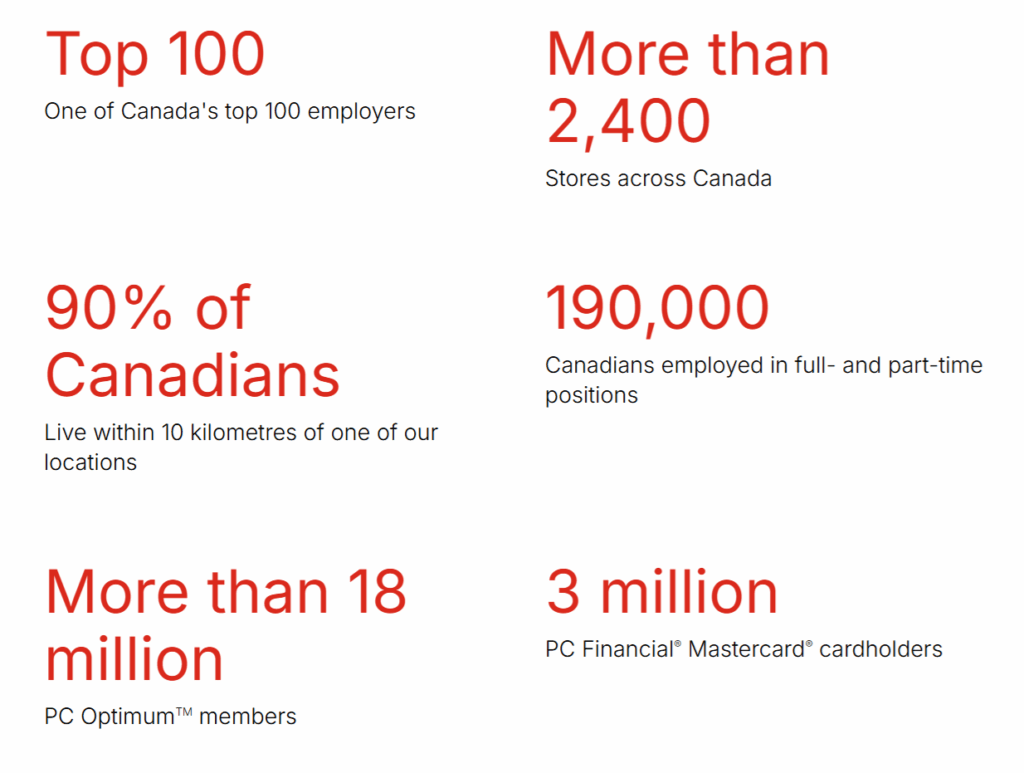
Loblaw (L.TO) is Canada’s largest food and pharmacy retailer, operating more than 2,400 locations across banners like Loblaws, No Frills, Real Canadian Superstore, and Shoppers Drug Mart. Its operations fall into two segments:
- Retail: food stores, discount banners, drug stores, in-store healthcare and beauty, apparel (Joe Fresh), and general merchandise.
- Financial Services: PC Financial credit cards and everyday banking services, insurance brokerage, and telecommunications.
It also owns some of the strongest private-label brands in the country — President’s Choice and No Name — and operates PC Optimum, one of Canada’s most successful loyalty programs.
This combination gives Loblaw a wide, diversified footprint across essential categories.
Why Investors Stick With It: The Investment Thesis
The Bull Case — Scale, Loyalty, and Steady Demand
Loblaw remains Canada’s largest grocery and pharmacy retailer, and that scale matters. With over 2,400 stores and leadership across both food and health, the company benefits from stable, non-discretionary demand that tends to hold up even when the economy weakens. Its mix of discount banners, full-service supermarkets, and Shoppers Drug Mart gives it broad reach and reliable cash flow.
A major advantage lies in its private-label power (President’s Choice, No Name) and the strength of PC Optimum, one of Canada’s most effective loyalty programs. These two pillars boost margins, reinforce customer loyalty, and help Loblaw stand out in a category where products are nearly interchangeable. Private label + loyalty is the engine that keeps traffic and profitability moving in the right direction.
Growth continues to come from the right places: discount formats, pharmacy and healthcare services, and digital retail initiatives. Pharmacy is growing faster than grocery, e-commerce adoption remains solid, and Loblaw continues to leverage its scale to expand earnings. Add disciplined capital allocation and steady dividend growth, and you get a reliable compounder in an industry where predictability is hard to find.
The Bear Case — Margins Under Pressure in a Brutal Industry
Even with its size, Loblaw operates in a brutally competitive, low-margin industry. Costco, Walmart, and Amazon keep constant pressure on pricing, while consumers increasingly shop multiple banners to find deals. This dynamic limits Loblaw’s pricing power and forces it to continually reinvest savings into keeping prices low — a structural cap on margin expansion.
Labour and regulation are another challenge. Loblaw faces high unionization rates, frequent wage negotiations, and persistent cost inflation. At the same time, both food retail and pharmacy are under heavy regulatory and political scrutiny, especially around drug pricing and food inflation. Any policy tightening could directly impact profitability.
Finally, Loblaw’s moat remains narrow. Grocery retail offers low differentiation and low loyalty, and even strong brands like PC can’t fully protect against market share erosion. The business must continually invest to maintain its edge, and any misstep in pricing, supply chain, or execution carries outsized risk in such a competitive field.
The ONLY List Using the Dividend Triangle
You may wonder how I find such high-quality dividend stocks.
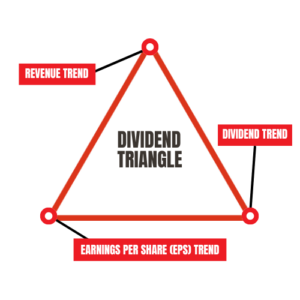
 I handpick companies with a strong dividend triangle (revenue, earnings, and dividend growth trends) and make sure I understand their business model. While this may seem too simple, two decades of investing have shown me it is reliable.
While many seasoned investors also use these metrics in their analysis, no one has created a list based on them before. This is exactly why I created The Dividend Rock Stars List.
The Rock Stars List isn’t just about yield—it’s built using a multi-step screening process to ensure the highest-quality dividend stocks. You can read more about it or enter your name and email below to get the instant download in your mailbox.
Latest News: Solid Traffic, Strong Pharmacy, Steady Execution
On August 13, 2025, Loblaw reported another solid quarter with revenue up 5% and EPS up 12%, driven by strong in-store traffic and continued pharmacy momentum.
Key takeaways:
- Food Retail same-store sales: +3.5%
- Drug Retail same-store sales: +4.1%
- Pharmacy & healthcare services: +6.2%
- Retail free cash flow: $640M, up from $475M
- 61 new store openings added to the network
- 2M shares repurchased for $405M
- Company reaffirmed outlook for high single-digit adjusted profit growth
- Announced a 4-for-1 share split effective August 18
Loblaw continues to benefit from strong customer traffic, growing baskets, and disciplined capital allocation.
The Dividend Triangle in Action: Steady and Predictable
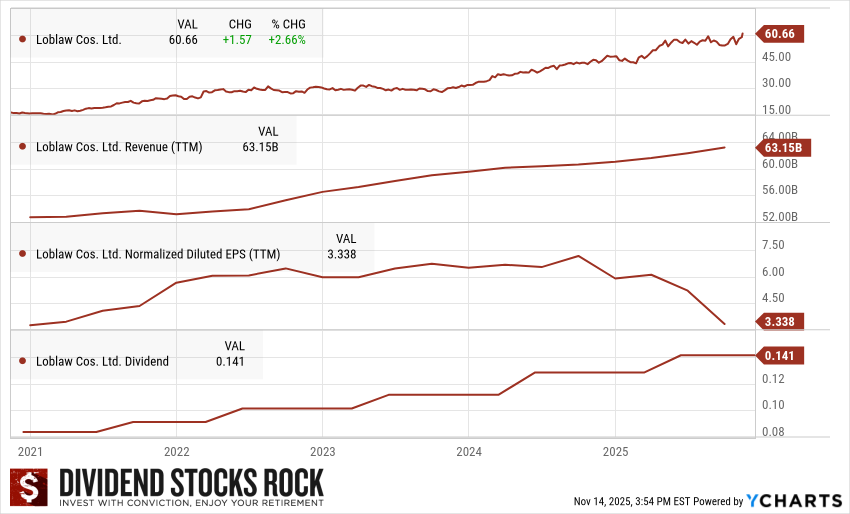
Loblaw’s Dividend Triangle — revenue, earnings, and dividend growth — reflects a company built for reliability rather than rapid expansion.
- Revenue: A long-term glide upward, supported by recurring grocery demand and expanding pharmacy services
- Earnings per Share: Trending higher over time, with disciplined cost control and strong contributions from Shoppers Drug Mart
- Dividend: Modest but consistent increases, backed by a conservative payout ratio and stable free cash flow
Loblaw remains one of Canada’s most dependable low-volatility dividend growers — not spectacular, but remarkably solid.
Final Words — A Stock You Already Support Every Week
Loblaw won’t deliver explosive growth — and it won’t build a wide economic moat either. But it will show up for investors the same way it shows up for shoppers: consistently.
It’s the kind of stock you buy when you want ballast in your portfolio. The business you shop at every week is the same business quietly compounding earnings, buybacks, and dividends in the background.
If you’re building a stable Canadian dividend portfolio, Loblaw deserves a spot on your radar.
Want More Dividend Rock Stars?
If you like dependable names like Fortis, don’t miss our Dividend Rock Star List — your guide to the best Canadian companies combining growth, stability, and reliable income for the long haul.
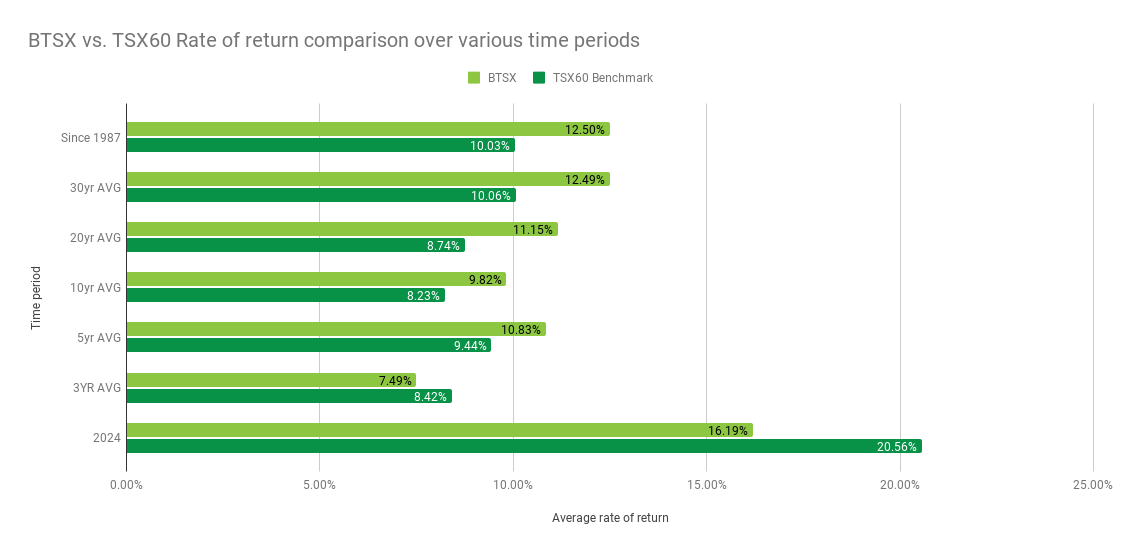
 #1 List the TSX 60 index by dividends.
 #2 Select the top 10 yielding stocks from the TSX 60
 #3 Buy the top 10 yielding stocks in equal weight.
 #4 Each January, review the new Dogs of the TSX and trade accordingly.