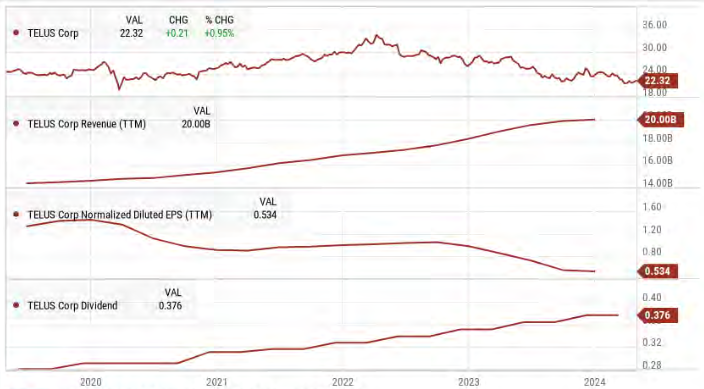
A buy list stock of mine since March 2023, Telus is still in my top five Canadian picks for growth. As future growth in the wireless industry is limited, Telus has diversified its business to find new growth vectors. The company is acting wisely in the face of the current headwinds by reducing its capital expenditures (CAPEX) and increasing its cash from operations. It hasn’t received a lot of love from the market in the last two years, and likely won’t in 2024, but I believe that will change eventually; in the meantime, investors enjoy consistent mid-single-digit dividend increases every year.
Invest with conviction. No more doubts or paralysis. Register for our upcoming May 30th webinar, or listen to the replay.
Telus Business Model
TELUS Corporation is a Canada-based telecommunications company. The Company provides a wide range of technology solutions, including mobile and fixed voice and data telecommunications services and products, healthcare software and technology solutions, and digitally led customer experiences.
Data services include internet protocol, television, hosting, managed information technology and cloud-based services, software, data management and data analytics-driven smart-food chain technologies, and home and business security. It operates through two segments.
- The technology solutions segment includes network revenues and equipment sales arising from mobile technologies, data revenues, some healthcare software and technology solutions, voice, and other telecommunications services revenues.
- The International segment is comprised of digital customer experience and digital-enablement transformation solutions, including artificial intelligence (AI) and content management solutions.
Build yourself a recession-proof portfolio! Learn how in our free workbook. Download it now!
Telus Investment Thesis
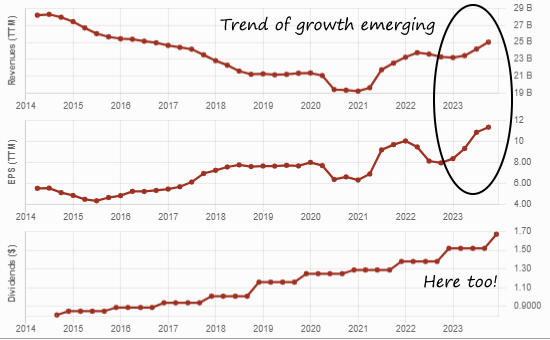
![]() Telus has grown its revenues, earnings, and dividend payouts very consistently. Very strong in the wireless industry, the company is now tackling other growth vectors such as internet and television services. Telus has the best customer service in the wireless industry as shown by its low customer loss rate. It uses its core business to cross-sell its wireline services. The company is particularly strong in Western Canada. Telus is well-positioned to surf the 5G technology tailwind.
Telus has grown its revenues, earnings, and dividend payouts very consistently. Very strong in the wireless industry, the company is now tackling other growth vectors such as internet and television services. Telus has the best customer service in the wireless industry as shown by its low customer loss rate. It uses its core business to cross-sell its wireline services. The company is particularly strong in Western Canada. Telus is well-positioned to surf the 5G technology tailwind.
Finally, Telus looks to original and profitable ways to diversify its business. Telus Health, Telus Agriculture, and Telus International (tech & games, finance, eCommerce, and artificial intelligence) (TIXT.TO) are small, but emerging divisions that should lead to more growth going forward. In 2022, Telus acquired Lifeworks for $2.3B to boost its health business segment.
In 2023, CAPEX slowed down ($2.6B) and was mostly financed by free cash flow ($2B). This explains why the company keeps its generous dividend growth streak alive. For 2024, the company expects lower CAPEX and stronger operating cash flow. We like that mix!
Want to see what our U.S. buy list stock if this month? See it here.
Telus Last Quarter and Recent Activities
Starting in 2023, the macroeconomic landscape has made it a challenging time for the telecommunications industry and Telus is no exception—years of fueling growth through cheap debt ended with rising interest rates.
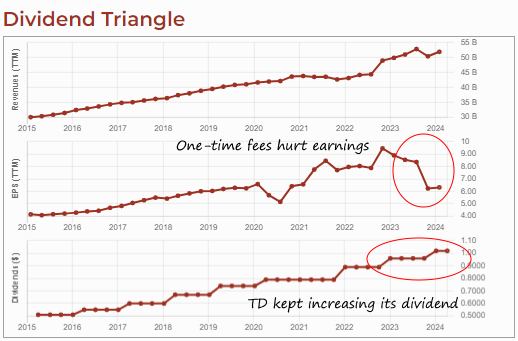
Telus recently reported lackluster results for Q1’24. Consolidated revenue was down 0.6% and adjusted EPS was down 3.7% compared to Q1’23. Revenue for wireless/wireline revenue was up 0.4%, but down in for Telus Health (-0.7%), Agriculture (-0.24%), and International (-.98%).
Cash flow from operations of $950M increased 25% from Q1’23, but free cash flow was down 26% to $396M, due in part to interest charges going up to $394M from $320M.
Telus is keeping its CAPEX stable, a wise move during this difficult time. It reaffirmed its 2024 full-year guidance that it will have sufficient cash flow to pay dividends.
Invest with conviction. No more doubts or paralysis. Register for our upcoming May 30th, webinar, or listen to the replay, here.
Potential Risks for Telus
Competition is increasing among the Big 3 in the wireless market; Rogers and Shaw merged, and a new player is arriving on the scene, with Quebecor acquiring Freedom Mobile. Margins could be under pressure in the future. Also, the federal government wants more competition for the “Big 3” and is likely to open the door to new competitors down the road.
As the wireless market becomes fully mature, Telus will need other growth vectors. TV & internet won’t be enough to prevent Telus from becoming another Verizon (VZ) ten years from now. We’re not convinced by the acquisition of Lifeworks, specifically its cost. We will see how Telus integrates the business into its Health division.
Finally, Telus’ debt has increased substantially, from $12B in 2015 to $27B in 2024. Higher rates might affect future profitability, especially if they persist. Everyone expects tate cuts in 2024, but so far, the Bank of Canada keeps delaying them due to inflation. The headwinds facing the company explain its stock performance as of late.
Telus Dividend Growth Perspective
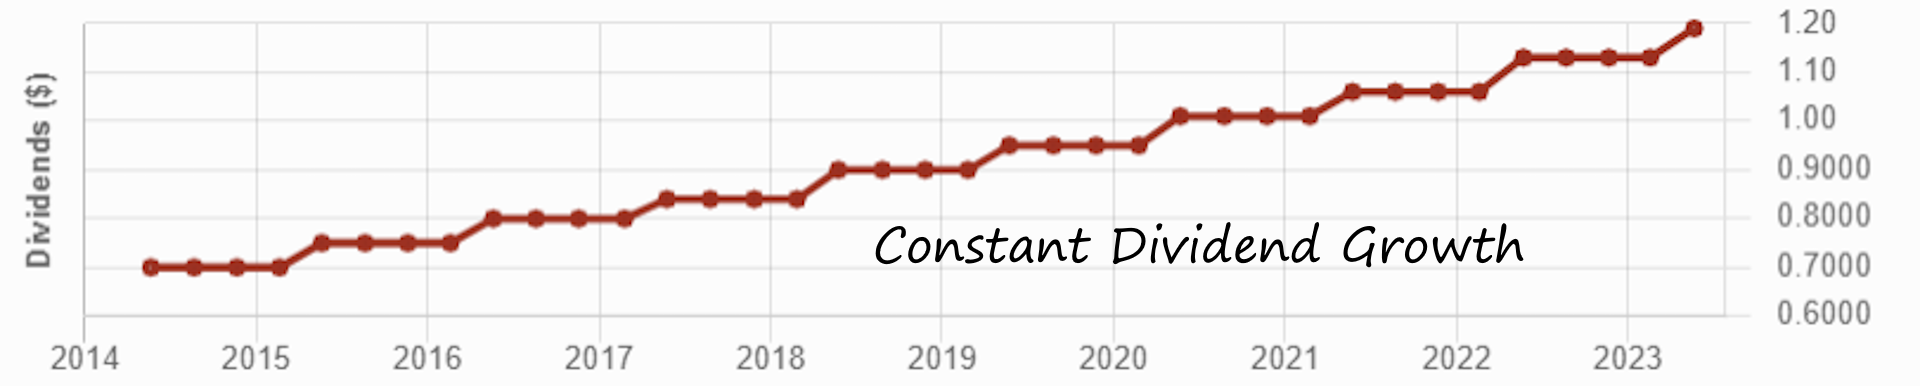
This Canadian Aristocrat is by far the industry’s best dividend payer. Telus has a high cash payout ratio as it puts more cash into investments and capital expenditures. Capital expenditures are regularly taking away significant amounts of cash due to their massive investment in broadband infrastructure and network enhancement.
Such investments are crucial in this business, and, for a good while, Telus filled the cash flow gap with financing. At the same time, Telus continued to increase its dividend twice a year, exhibiting strong confidence from management. In 2023, Telus increased its dividend twice for a total increase of 7% for the year.
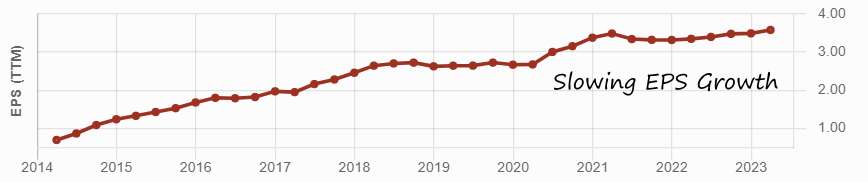
However, with the higher cost of debt and other macroeconomic challenges, Telus has wisely reduced its capital expenditures. This decision has already helped increase its operating cash flow, contributing to the dividend’s safety. Investors can still expect the dividend to increase, but I suspect the dividend growth will slow down in 2025 while the company faces the current headwinds and because of its lower free cash flow.
Build yourself a recession-proof portfolio! Learn how in our free workbook. Download it now!
Final Thoughts on this Buy List Stock
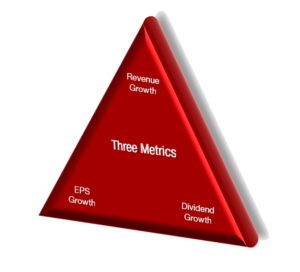
The story for Telus in 2024 is about three important metrics: cash from operations, capital expenditure (CAPEX), and free cash flow. I want to see the first one go up, the second one go down, and the last one to cover the dividend payments. I have Telus in my portfolio. Over the next few quarters, I will keep an eye on these metrics.
Right now, Telus is struggling a bit and not performing as well as I’d like. I still see a lot of potential in its diversified business areas, Telus Health, Telus Agriculture, and Telus International. These should eventually generate growth for the company. For a patient investor who’s in it for the long haul, Telus could be a great opportunity and that’s why it’s a buy list stock of mine.
 To mitigate the risk of utilities having too much power, some countries, provinces, or states nationalized these resources to provide them at a lower price. Often, in Canada and the U.S., governments allow private companies to manage and distribute electricity, gas, and water. Granting such power to private entities couldn’t be done without strict rules. Hence, utilities usually operate in a highly regulated environment. Governments decide the price of power and water that is charged to customers.
 Most often, those projects are financed by issuing additional shares of stock or taking on more long-term debt. When interest rates rise, the cost of new financing increases, reducing the projected profitability of the project. In short, there will be less cash left to increase the dividend.
 When we describe consumer staples, we often say they are all the products you can find in your house. Products you must buy no matter what happens in your life. Companies in this sector have built stellar brand portfolios that support repeat purchases from their customers. Repetitive purchases lead to constant and predictable cash flows. Therefore, food, beverage, and household products are a great foundation for building a dividend growth portfolio.
 Since consumers rely on many of these products, they’ll likely cut their expenses for consumer discretionary products, such as restaurant meals, non-essential clothing, travel, and entertainment, to prioritize consumer staples products. Keep in mind that while stocks in this sector offers great protection when the market goes sideways, you must have them before market sentiment shifts downward to benefit from their protection. When the market panics, consumer staples usually trade at higher valuations, i.e., their PE ratios increase.
 It’s hard to identify a good time to buy consumer staples stocks because they’re rarely “on sale”. When everybody is making money in the market and growth stocks get most of the love, you have a shot at buying lesser-loved consumer staples. This is the type of investment that you almost regret having made during a bullish year because they often lag, showing minimal growth during boom times. On the other hand, when panic spreads, these companies hold the fort and ensure your portfolio doesn’t go bust.