It’s hard for investors to know what to expect for 2024. Recession or a soft landing? Interest rates cut? What about bonds? And politics and wars? Here’s some insight.
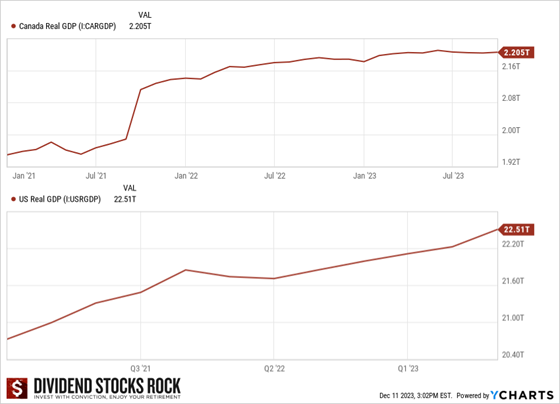
Currently, a contrast exists between the resilient U.S. economy, driven by enthusiastic consumers, and a Canadian economy showing fatigue due to the strain of continuous spending. Long fixed-rate mortgage contracts in the U.S. versus the 5-year contracts in Canada contribute to this contrast.
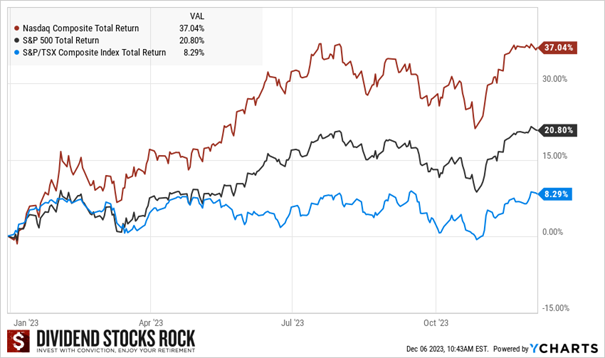
Despite the S&P 500’s impressive double-digit growth in 2023, this surge was primarily propelled by a select few mega-cap stocks, known as the “magnificent 7,” contributing two-thirds of it.
See part of our best dividend stocks selection for 2024, download our Top Stocks booklet now!
Recession – Are We There Yet?
Predictions of a 2023 recession, including mine, were wrong. However, we saw the first signs of a slowdown in Canada in late 2023. Not calling it a recession…yet. I’m still convinced the economy will suffer from the combination of high inflation and high interest rates.
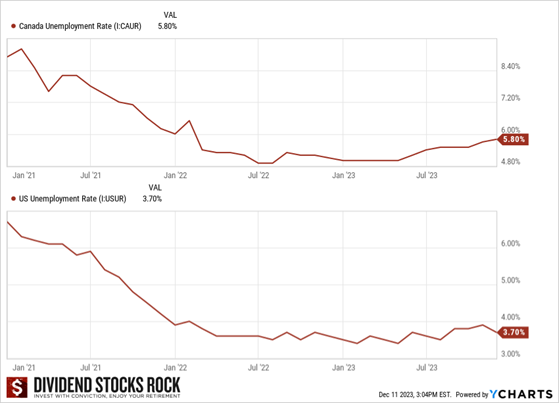
Although a slowdown might loom in 2024, robust job markets in the U.S. and Canada, coupled with demographics where more people retire than join the workforce, might help the soft landing wished for by central banks.
Recession or not, current interest rates will significantly affect 2024.
Lower earnings
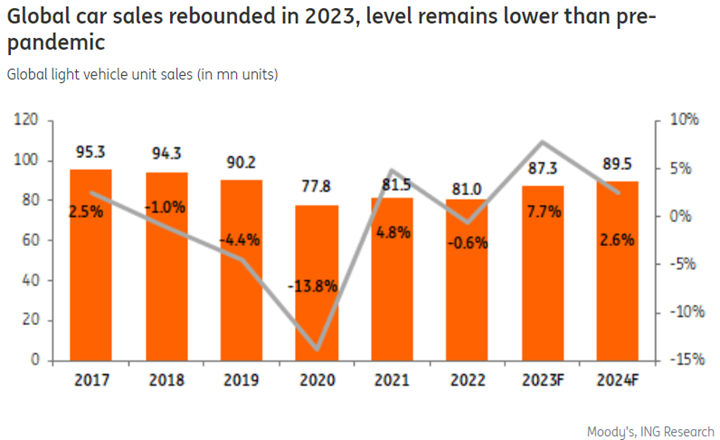
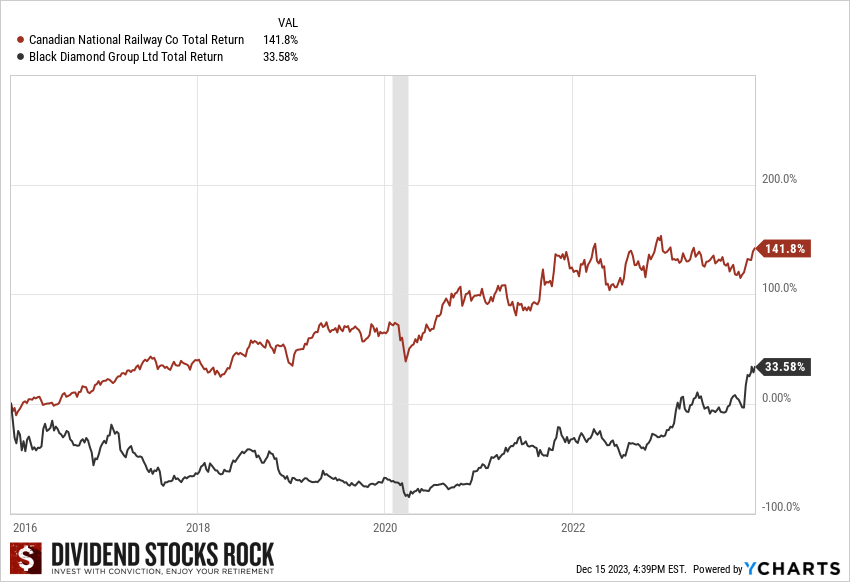
Expect weaker corporate earnings, especially in the industrials, automotive, and consumer discretionary sectors, affected by restrained consumer spending. Canadian Tire (CTC.A.TO) sold fewer discretionary items as consumers focus on essential purchases; U.S. Home Depot (HD) consumers take on smaller projects; car sales will barely go up; and so on.
Holdings in such cyclical companies are in for a few poor quarters. Should you jump ship? Short answer: no.
Zombie companies, interest rates
The number of Zombie companies, unprofitable businesses that survive by taking on new debt, went from roughly 500 to over 700 in 5 years.
Despite possible rate cuts for 2024, we won’t be going back to a cheap money era. Interest rates will stay relatively high as companies renew their debt. We’ll see zombie companies die and interest charges rise for capital-intensive businesses, including telcos, utilities, and REITs. This lagging effect will last the year and beyond. Brace for impact.
See part of our best dividend stocks selection for 2024, download our booklet now!
Market liquidity
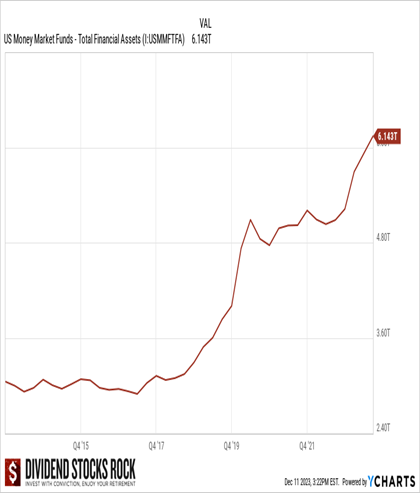
This paints a pretty bleak future for your investments. However, there’s $6 trillion sitting in cash on the sidelines, the highest level ever seen in U.S. money market funds. If the Fed announces rate cuts, that money won’t go into bonds or in declining high-interest savings accounts; it’ll likely return to the market. Another reason to stay invested in holdings you’re confident about.
Bond rally?
The current inverted bond yield curve shows short-term bonds offering higher yields than long-term bonds, a sure sign that the market thinks interest rates will decline.
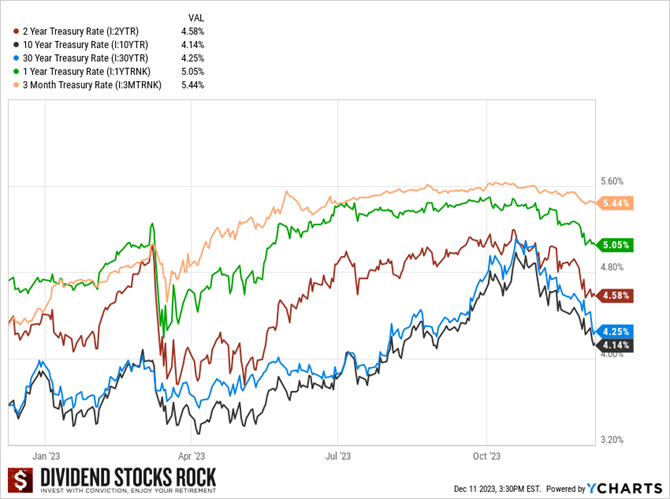
I’m not a fan of jumping from one strategy or asset allocation to another, and I’m not recommending that you do so. However, income-seeking investors might want to look to bonds. Short-term bonds tied interest rates should do well in 2024 as opposed to long-term bonds.
AI for Cost Savings?
Suffering from the slowdown, higher interest charges, inflation, what will companies do? Lower their costs to improve their margins. Using artificial intelligence (AI) is a way to enhance productivity.
A sound strategy for investors is finding companies that will profit from the AI wave, no matter what; there are even dividend payers among them!
- Chip markers: Nvidia and AMD are obvious winners. Other semiconductors companies (TSM, Broadcom or Intel) could also benefit from the quantity of chips AI needs. Semiconductor equipment providers (Lam Research or ASML) could see their backlog grow.
- Software enterprises: Companies could use AI to improve their software products; others, like Accenture, to boost their consulting and strategy services.
- Healthcare: Healthcare companies like Abbott Laboratories, Medtronic, and McKesson already invest in AI to improve productivity.
See part of our best dividend stocks selection for 2024, download our booklet now!
Renewables & Infrastructure Investment
Relying heavily on debt to fund projects and government investment, renewable utilities have been on a rollercoaster for two years, with the wind energy industry the most affected.
Setting up wind farms is complex and costly, as is connecting them to the grid. Vast quantities of raw materials are needed, and inflation made construction costs explode. Wind energy a less performant energy solution for now when compared with the ease of installing solar panels on rooftops!
Solar energy is a cheap way to generate electricity. Like wind, it’s an intermittent energy source but more predictable.
The solution for reducing carbon emissions is a combination of hydro electricity, wind & solar energy, natural gas, and potentially nuclear energy. Governments will spend billions in renewable projects, leading to major infrastructure spending. My favorites are Brookfield (Renewable and Infrastructure), NextEra Energy (the parent company) and Xcel (regulated/green energy mix). But utilities aren’t the only ones to benefit from this wave of money…
Alternative asset managers
Infrastructure projects don’t generate cash flow immediately, far from it. To invest and manage them, you need specialists called alternative asset managers.
Investing in alternative asset managers is a great way to diversify your portfolio. Usually, their returns aren’t determined by what’s happening on the market, and they can be about 5-7% above inflation over long periods. My favorites? Brookfield (BN or BAM) and Blackstone (BX).
Short-Term vs. Long-Term
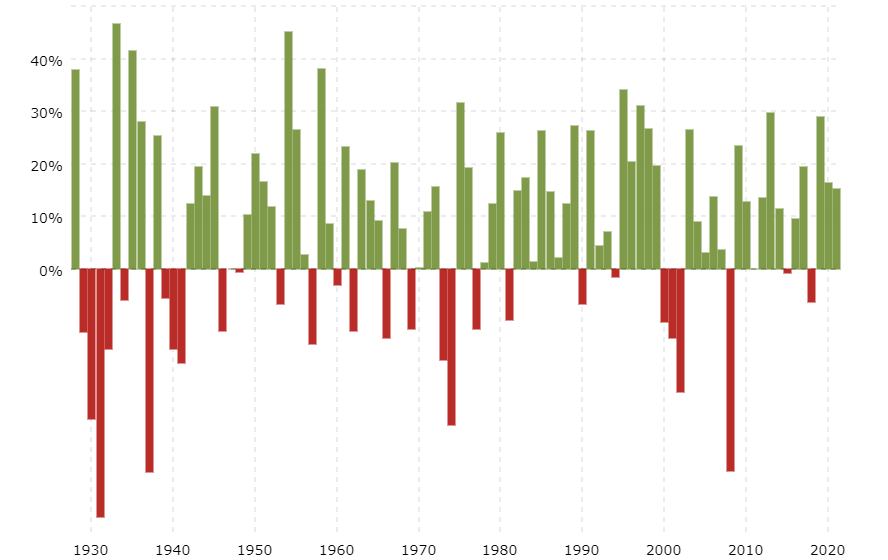
The short-term view of the market might be cloudy, but long-term looks much brighter:
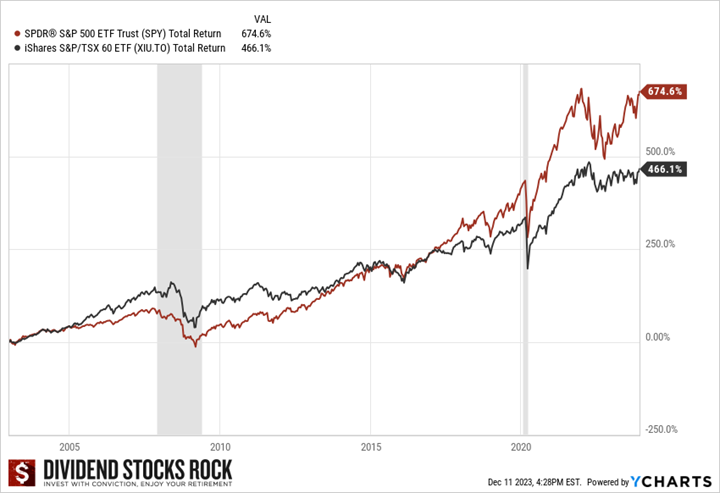
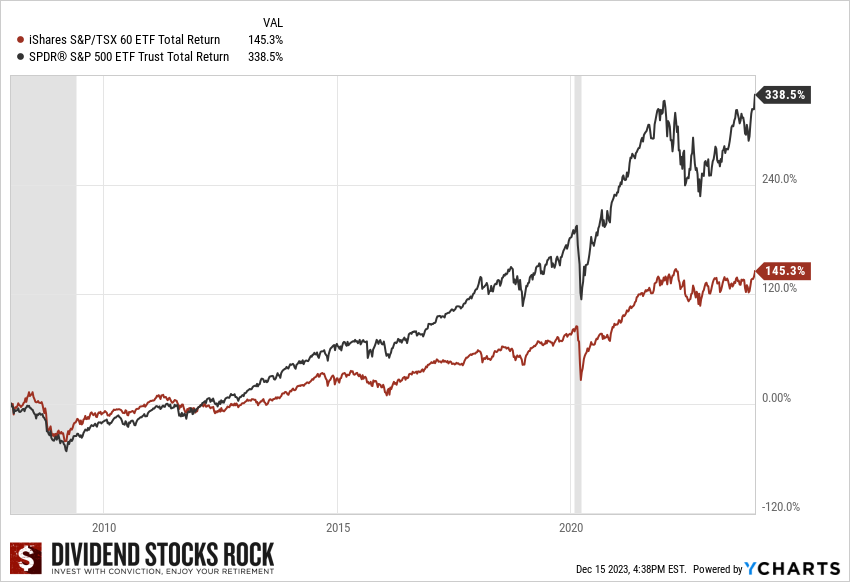
Staying on the sidelines after the tech bubble crash, 9/11, the financial crisis, the European debt crisis, Brexit, or COVID-19 would have meant missing 20 magical years on the market! Conclusions:
- Staying invested is the best solution, always.
- The market might not give you much for several years. Be patient and focus on your growing dividends.
2024 Playbook
Don’t overhaul your investing strategy and start over. Adjust your portfolio to ensure you are well-invested and poised for what’s coming. A potential long bear market affects investors who are invested and those with cash on the side. Here’s the playbook.
Invested investors
- Review your portfolio; ensure it’s well-diversified across several sectors
- Identify weaker looking stocks; re-examine if you still want to hold them
- Trim overweight positions
- Optimize your holdings with better stocks (strong metrics, growth potential)
- Build a cash reserve if you’re retired and depend on your portfolio to generate income
Cash on the side investors
You could wait for years and never get today’s price again. Instead:
- Build a list of stocks to buy now
- Invest 33% of your money now
- Wait for a quarter, review earnings, invest another 33%.
- Rinse & repeat for another quarter to fully invest your money.
The goal is to make sure your portfolio thrives no matter what happens on the market:
- You invest 33% just days before a crash starts. Major market crashes are intense, but the down trend doesn’t last very long. Therefore, three and six months down the line, you’ll have bought during the dip, averaging down with cheaper prices.
- Alternatively, you invest 33% just the market begins a 5-year bull run. You’ll slowly build a profit cushion with an average price below the market.
Wars & political tensions
Ongoing geopolitical tensions and conflicts make headlines, scare the market, and cause tragedies, but their long-term impact on investments is limited. Think about how fast natural gas prices returned to pre-war levels while the Russia-Ukraine war still rages. Companies carry on and adapt quickly to new circumstances.
Quality income investments
Don’t just go exclusively for yield. It’s okay to have higher yield-stocks, but find companies that won’t let you down and that keep increasing their generous dividends. To safeguard your portfolio, focus on dividend safety.
Reduce your exposure to stocks you’re not 100% convinced about to prevent a huge hole in your portfolio if they crash.
Final Thoughts
As always, navigating the uncertainties of 2024 requires that you remain loyal to a straightforward strategy, echoed by Peter Lynch: know what you own and why you own it.


 Studies show that most individual investors like you and me lag the market… big time. Think of famous investor Peter Lynch who managed the Fidelity Magellan Fund from 1977 to 1990 generating an annualized return of 29%. Fidelity later revealed that the average Magellan Fund investor lost money during this period. How is that possible? Investors were simply not investing with conviction, and they didn’t stick to their plan, especially at times when the market dropped.
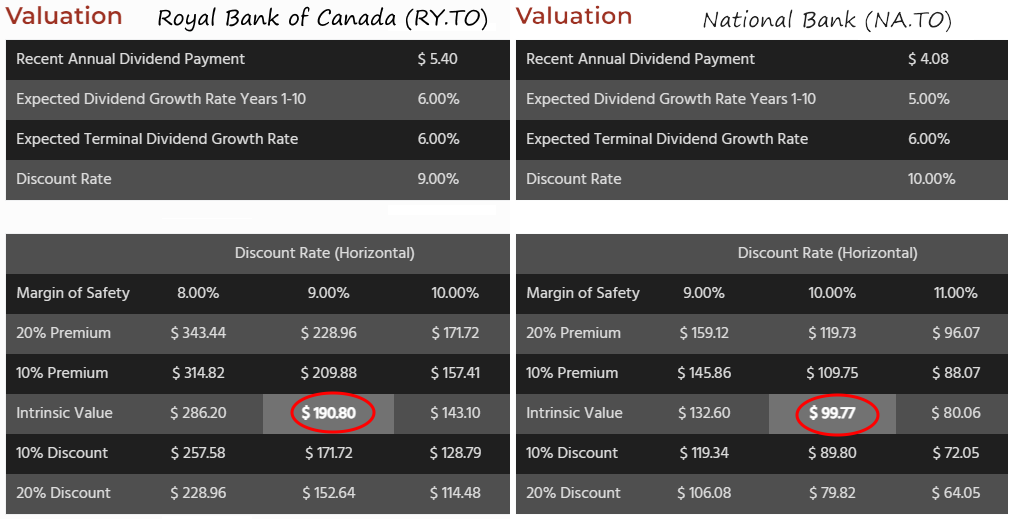
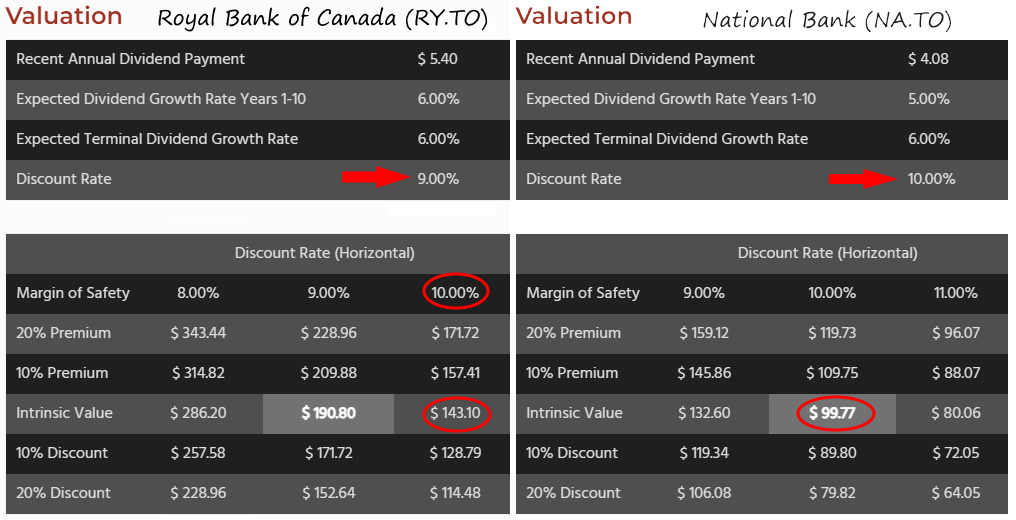
 I don’t use valuation to determine if the company is undervalued or not because, to be honest, your guess is as good as mine. If you put ten financial analysts in a room and ask them to determine the valuation of a company, you’ll likely end up with ten materially different answers.


 Now comes the fun part. I identify potential risks and growth prospects for each company. It’s important to be realistic and not get carried away by the positive aspects. I look at growth trends to see if they’re slowing down, review the evolution of company debt over the years, and consider potential downsides like vulnerability to inflation, interest, regulation, patent expiry, and competition. I read up on bear theses to understand why some investors might dislike a company. It’s important to know what I’m getting into and to be prepared for any challenge that may arise.