• Skip to main content

MOOSE MARKETS

INVESTING THE CANADIAN WAY

  • Dividend Investing
    • Best Canadian Stocks to Buy in 2025
    • Dogs of the TSX – Beat The TSX! 2025
    • Canoe Income Fund
    • Canadian Banks Ranking 2025
    • Canadian Dividend Rock Stars List
    • Canadian Dividend Aristocrats 2025
    • Buy and Hold Forever Stocks
  • REITs
    • Canadian REITs Beginner’s Guide
    • Best Monthly REITs 2025
  • How To
    • Income Products at Retirement
    • 4 Budgets of Retirement
    • Create a Cash Wedge at Retirement
    • 5 Questions for a Confident Retirement
  • ETFs
    • Guide to ETF Investing
  • Portfolio Strategies
    • Canadian Depositary Receipts (CDRs)
    • Building an Income Portfolio – Made Easy
  • Newsletter
  • Podcast

Dividend Stocks

The Canadian Dividend King That Powers Portfolios

Some companies chase growth; others define stability. Fortis falls squarely in the latter camp — a true Dividend King with over 50 consecutive years of dividend increases, making it one of the most reliable income plays in North America.

While it may not grab headlines with flashy innovation, this utility powerhouse has quietly powered millions of homes — and countless portfolios — with the same steady rhythm for half a century.

If you’re building a portfolio to last, Fortis earns a spot on your shortlist right alongside the names featured in our Canadian Forever Stock Selection.

Business Model: Regulated Power, Predictable Growth

Fortis (FTS.TO) is one of North America’s largest regulated utility companies, serving over 3.5 million customers across Canada, the U.S., and the Caribbean. Its operations span electricity and natural gas distribution, transmission infrastructure, and renewable energy projects.

Roughly 99% of its earnings come from regulated operations, giving the company one of the most stable revenue bases in the market. Major subsidiaries such as ITC Holdings (U.S.), UNS Energy (Arizona), and FortisBC provide geographic and regulatory diversification.

This structure provides reliable cash flows, allowing Fortis to fund steady dividend growth and a robust C$26 billion capital plan through 2028.

Why Invest in Fortis, as found in its Q2 2025 Investors Presentation.

Investment Thesis: Powering Ahead with Predictability

Bull Case: A Model of Consistency

Fortis has mastered the art of slow, steady, and sustainable growth. Its regulated revenue model offers unmatched visibility into future earnings, while its ongoing capital investments fuel long-term expansion. The utility plans to grow its rate base by 6.5% annually through 2028, driven largely by investments in its U.S. transmission network (ITC) and renewable energy initiatives.

The company’s ability to deliver 4–6% annual dividend growth through 2029 underscores its commitment to shareholders. Fortis has raised its dividend for 51 consecutive years, placing it in the rare category of Canadian Dividend Kings.

Growth drivers include:

  • Large-scale grid and transmission expansion in the U.S. Midwest and Canada
  • Transition of coal assets to natural gas and renewable generation
  • Strategic investments in offshore wind and renewable natural gas
  • Inflation-linked rate base adjustments ensure cash flow protection

Fortis remains one of the few utilities offering steady earnings growth, inflation resilience, and reliable dividend compounding — all wrapped in a conservative, defensive package.

Bear Case: Regulated Stability Comes with Limits

While Fortis provides safety and predictability, it isn’t immune to headwinds. The company’s heavy reliance on debt-funded capital projects makes it sensitive to rising interest rates and financing costs. Approximately one-third of its current capital plan is funded through debt, a structure that works best in stable-rate environments.

Additionally, currency risk is real — with roughly 60% of earnings generated in the U.S., fluctuations in the CAD/USD exchange rate can impact results.

The regulated nature of its business also means limited upside: returns are capped by rate decisions from regulators. While this reduces volatility, it also constrains potential outperformance compared to faster-growing peers like Hydro One or Emera.

Finally, environmental and policy shifts — particularly around carbon reduction — could pressure Fortis to accelerate its transition spending faster than planned, straining capital budgets.

Latest News: Staying on Plan and On Track

On August 8, 2025, Fortis reported a solid quarter with EPS up 13% year-over-year, driven by continued execution of its capital plan and strong regulatory outcomes.

The company reaffirmed its C$26 billion five-year capital plan, including:

  • Converting 793 MW of coal generation at TEP’s Springerville station to natural gas by 2030
  • Achieving a coal-free portfolio by 2032
  • Growing its regulated rate base from US$39B (2024) to US$53B (2029) — a 6.5% CAGR

With $2.9 billion in capex deployed in the first half of 2025, Fortis remains firmly on schedule and continues to target annual dividend growth of 4–6% through 2029.

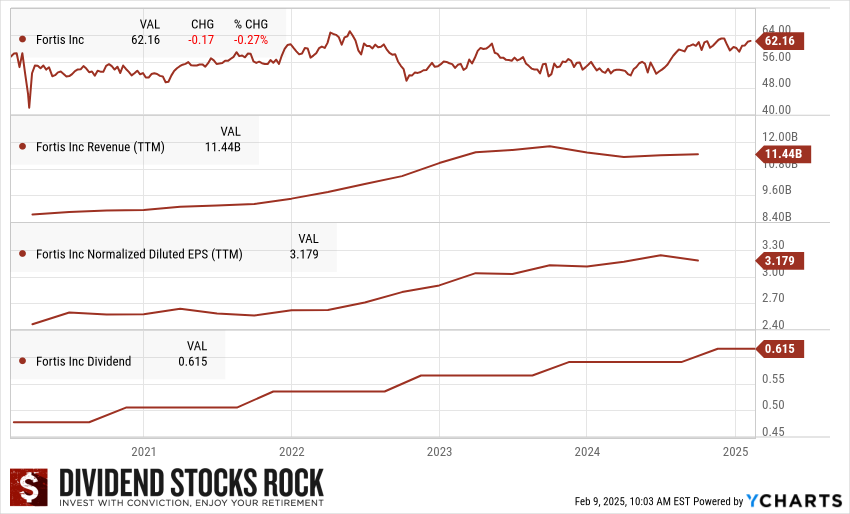
The Dividend Triangle in Action: Stability You Can Count On

Fortis (FTS.TO) 5-year dividend triangle.

Fortis’s Dividend Triangle — the combination of revenue, earnings, and dividend growth — demonstrates remarkable consistency over the past decade.

  • Revenue: Steady growth driven by rate base expansion
  • Earnings per Share: Reliable increases supported by predictable cash flows
  • Dividend: A 51-year streak of increases — the gold standard of dependability

Final Words: The Dividend King of Consistency

Fortis doesn’t aim to surprise the market — it aims to outlast it. With a proven management team, strong regulatory relationships, and an unbroken dividend growth record stretching over five decades, this utility remains a cornerstone holding for dividend investors seeking peace of mind.

It’s the kind of stock that may never dominate headlines, but it will quietly power your portfolio through any market cycle.

Want More Dividend Rock Stars?

If you like dependable names like Fortis, don’t miss our Dividend Rock Star List — your guide to the best Canadian companies combining growth, stability, and reliable income for the long haul.

Red star.

Turning Trash into Steady Treasure

Waste might not be glamorous, but it’s one of the most reliable businesses out there. In good times or bad, people still generate garbage — and someone has to collect it. That simple reality has made the waste management industry a quietly powerful source of recurring revenue and growing dividends. Among the sector’s leaders, one company stands out for its disciplined growth, smart acquisitions, and focus on steady returns.

A Fortress Built from Waste

Waste Connections (WCN.TO) operates a vast network of landfills, transfer stations, and collection routes across the U.S. and Canada, serving roughly nine million residential, commercial, and industrial customers. It collects, transports, and disposes of non-hazardous solid waste while also managing recycling and renewable fuel recovery programs.

What makes the company unique is where it operates — primarily in secondary and rural markets. These regions face less competition and lower regulatory friction than dense urban areas, allowing for superior pricing flexibility and stronger margins.

Its integrated model — from curbside pickup to landfill disposal — provides both efficiency and pricing control. Add to that long-term municipal and industrial contracts, and you get a business that hums along through economic ups and downs.

Waste Connections (WCN.TO) at a glance, from its Q3 2025 Investor Presentation.

Investment Thesis: Built to Withstand the Cycle

Bull Case — Consistency You Can Count On

This is the kind of company dividend investors love: predictable, cash-generative, and built to last. Waste Connections benefits from steady demand, high switching costs, and barriers to entry that few industries can match.

Playbook:
The company generates most of its revenue from recurring waste collection and disposal services. Its strategy is to expand organically while acquiring smaller operators, integrating them into its efficient network. By controlling every step of the waste stream, it captures value others miss — from landfill tipping fees to recycling recovery.

Growth Vectors:

  • Acquisitions remain the backbone of growth. The purchase of Secure Energy Services’ Canadian disposal assets boosted both revenue and margin potential.
  • Core pricing power is another strength — solid waste pricing rose 6.6% year-over-year in the latest quarter.
  • Recycling and environmental services are emerging growth levers as the company expands into renewable fuels and materials recovery.
  • Strong cash generation supports continued investment and dividend increases, with adjusted free cash flow projected near $1.3 billion this year.

Economic Moat:
The moat here is real and durable. Landfill scarcity and regulatory hurdles make it extremely difficult for new competitors to enter. Once contracts and routes are established, customer churn is minimal. Waste Connections can raise prices above inflation without losing volume — a rare feat in any industry.

Bear Case — Even Strong Businesses Have Limits

Despite its resilience, this isn’t a risk-free story. The waste management sector carries its own operational and environmental challenges.

Business Vulnerabilities:
The company’s acquisition-heavy model demands constant integration. As industry consolidation continues, finding attractively priced targets will get tougher. Rising labor and equipment costs could also erode margin gains over time.

Industry & Market Threats:

  • Recycling volatility remains a headwind — commodity price swings can cause sharp revenue fluctuations.
  • Regulatory pressure is increasing, particularly as cities push for reduced landfill usage.
  • A slowdown in commercial and industrial activity could weigh on waste volumes if the economy softens.

Competitive Landscape:
While the company enjoys a strong position in smaller markets, larger peers like Waste Management (WM) and Republic Services (RSG) dominate urban centers and are expanding their sustainability initiatives. If governments tighten environmental standards or encourage municipal recycling, the competitive gap could narrow.

The ONLY List Using the Dividend Triangle

You may wonder how I find such high-quality dividend stocks.

I handpick companies with a strong dividend triangle (revenue, earnings, and dividend growth trends) and make sure I understand their business model. While this may seem too simple, two decades of investing have shown me it is reliable.Red star.

While many seasoned investors also use these metrics in their analysis, no one has created a list based on them before. This is exactly why I created The Dividend Rock Stars List.

The Rock Stars List isn’t just about yield—it’s built using a multi-step screening process to ensure the highest-quality dividend stocks. You can read more about it or enter your name and email below to get the instant download in your mailbox.

Latest News — Another Quarter of Steady Gains

August 8, 2025: The company reported another solid performance, with revenue up 7% and EPS up 4.7%. Core pricing in solid waste services increased 6.6%, leading to roughly 70 basis points of margin expansion.

Management reaffirmed full-year 2025 guidance:

  • Revenue: ~$9.45 billion
  • Adjusted EBITDA: ~$3.12 billion (≈33% margin)
  • Adjusted Free Cash Flow: ~$1.30 billion
  • CapEx: $1.2–$1.25 billion

Those numbers highlight the beauty of the model — dependable growth, disciplined spending, and resilient profitability even amid inflation and volatile commodity trends.

The Dividend Triangle in Motion

Waste Connections (WCN.TO) 5-Year Dividend Triangle chart.

Waste Connections may not boast the highest yield, but it’s a classic dividend grower. Its consistent pricing gains and cash flow discipline translate into sustainable, long-term dividend growth.

  • Revenue: $12.9 billion (TTM), rising steadily year after year.
  • Earnings per Share (EPS): $3.55 TTM, rebounding from recent acquisition-related costs.
  • Dividend: $0.434 per share, continuing its climb with a payout ratio comfortably below 25%.

The company’s dividend may look modest, but its growth record is strong, with double-digit hikes common in recent years. Investors can expect more of the same as earnings and cash flow expand.

Final Take — The Steady Hand in a Messy World

In an unpredictable market, it’s refreshing to find a company where performance isn’t tied to consumer confidence or economic cycles. Waste Connections turns necessity into opportunity, combining a recession-resistant business with disciplined management and reliable dividend growth.

Its focus on smaller markets, strong pricing power, and steady free cash flow give it a long runway for shareholder returns. This isn’t a flashy story — it’s a dependable one. And sometimes, that’s exactly what a dividend growth portfolio needs.

Find Other Buy and Hold Forever Stocks: Download the Dividend Rock Stars List

This dividend stock list is updated monthly. You will receive the updated version every month by subscribing to our newsletter. You can download the list by entering your email below.

This isn’t just a list of high-yield stocks—it’s a handpicked selection of Canada’s best dividend growth stocks backed by detailed financial analysis.

Red star.

  • Monthly updates
  • Full dividend safety ratings
  • 10+ Metrics with filters

Enter your email to get the latest Canadian Dividend Rock Stars List now!

Canadian REITs Beginner’s Guide

Want exposure to real estate without the hassle of fixing leaky faucets or chasing tenants for rent? That’s where Canadian REITs come in. These high-yield investments offer steady income, inflation protection, and real estate exposure — minus the landlord stress.

Thanks to their unique tax structure, REITs are designed to return most of their income to shareholders, making them ideal for income-seeking investors.

What Are REITs & Why They Matter?

REITs are not only popular because they distribute generous dividends, but also because they’re easy to understand. Investors can picture an apartment building or an office tower and tenants paying their rent monthly. Investors are willing to purchase units of those businesses in exchange for the income and peace of mind.

The concept of being a landlord and having tenants is comparatively simple to understand. The company owns and manages real estate and receives rental income from properties such as apartment complexes, hospitals, office buildings, timber land, warehouses, hotels, and shopping malls.

Most REITs are equity REITs. They must invest most of their assets (75%) into real estate (properties) or cash equivalents. In other words, they cannot produce goods or provide services with their assets. They must generate 75% of their income from those real estate assets in the form of rent, interest on mortgages, or sales of properties.

REITs must also pay a minimum of 90% of their taxable income as dividends to shareholders each year. Therefore, the classic earnings per share (EPS) and dividend payout ratios don’t gauge an REIT’s health.

3 Types of REITs: Equity, Mortgage, and Hybrid

Equity REITs

Equity REITs own and invest in property. They may own a diversified set of properties, and they generate income primarily in rent payments from leasing their properties.

Mortgage REITs

Mortgage REITs, or mREITs for short, finance property. They generate income from interest on loans they make to finance property.

Hybrid REITs

Hybrid REITs do a bit of both, as they own property and finance property.

In general, REITs offer great investment opportunities by their nature. A growing economy leads to growing needs for properties. REITs can grow organically as the population requires more industrial facilities, healthcare centers, offices, and apartments.

Sub-Sector (Industry)

REIT – Diversified REIT – Mortgage REIT – Specialty
REIT – Healthcare Facilities REIT – Office Real Estate – Development
REIT – Hotel & Motel REIT – Residential Real Estate – Diversified
REIT – Industrial REIT – Retail Real Estate Services

The Hidden Strengths of REITs

REITs are unique as they distribute most of their income. In fact, they exist to pay generous distributions. This makes them one of the retirees’ favorite sectors!

Therefore, it’s easy to understand how most offer a relatively high dividend income. This is one of the rare sectors where you can find “relatively safe” stocks paying 5%, 6%, or even 7%+. Investors must be careful not to get too greedy, though. We have seen several REITs cut their dividends due to poor management or economic downturns.

REITs usually bring stability to a portfolio. It’s a great sector to start with if you want additional income. Real estate brings significant diversification to your portfolio. Research has proved that REITs are not directly correlated to stock market movements over the longer term.

Finally, since most of them operate with escalator contracts, they offer great protection against inflation. Many income trusts include yearly rent increases in their leases to ensure rental income matches inflation. Some REITs also use Triple-Net leases, where the tenants is responsible for insurance, taxes, and maintenance costs, thus reducing the REITs’ expenses (and risk of unexpected charges!).

REITs: The Risks You Need to Know

One of the REIT sectors’ favorite ways to finance their new projects is to issue more units. Therefore, if a company purchases a property generating $20M per year but needs to issue more units to finance the purchase, you must look at the net outcome for unitholders. If the FFO per share drops, this is not necessarily good for you as it will affect the REIT’s ability to increase its dividend in the future.

Another downside related to their business model is their lack of flexibility. We have often seen REITs try to shift their focus from one industry to another. In most cases (H&R, RioCan, Boardwalk, and Cominar, to name a few), the trajectory change comes with a dividend cut and a loss in value for unit holders. A REIT wishing to get rid of its shopping malls to buy more industrial properties will likely have to sell properties at a lower price and pay a hefty price to buy more appealing assets.

Finally, don’t make the mistake of thinking REITs are safer than other sectors. They are companies facing challenges while benefiting from tailwinds. While you may argue that an apartment building can’t go anywhere, I would answer that if you have one hundred empty apartments due to an oversupply in a neighborhood, your money will also go nowhere.

The REIT sector is best for income investors.

Target sector weight: For income-seeking investors, you can aim at 15% to 30% (if you invest in various industries). For growth investors, REITs could represent a 5%-15% portion of your portfolio.

Protect Your Portfolio: Canadian Rock Stars List

REITs can provide good income, but they are all part of the same sector. You need more diversification for your portfolio to be fully protected of market events.

Red star.

I have created a list showing about 300 companies with growing revenue, earnings per share (EPS), and dividend growth trends. Focusing on trends rather than numbers gives you a better perspective on past, present, and future growth.

The Dividend Rock Stars List is the best place to start your stock research. Get it for free by entering your name and email below.

How to Analyze a REIT (The 3 Must-Know Metrics)

While REITs are among a short list of sectors that are perfect for retirees or other income-seeking investors, it is important to understand that they cannot be analyzed using the same metrics as other sectors.

Funds From Operations (FFO/AFFO)

The Funds from Operations (FFO) and Adjusted Funds from Operations (AFFO) are probably the most valuable tools for analyzing a REIT’s financial performance. Those two metrics replace the earnings and adjusted earnings for a regular stock. While those are different metrics, it’s all about cash flow and the REITs’ ability to sustain their dividend payments.

Fortunately, we can find those metrics inside each REIT’s quarterly report and subsequent press release. It’s important to follow not only the total FFO/AFFO, but also the FFO/AFFO per share (or unit of ownership) rather than earnings per share (EPS) or adjusted earnings per share.

FFO = Earnings + Depreciation (Amortization) – Proceeds from Property Sales

AFFO = Earnings + Depreciation (Amortization) – Proceeds from Property Sales – Capital Expenditures

Loan to Value Ratio (LTV)

The loan-to-value ratio (LTV) is a great tool for analyzing the REIT’s future ability to raise low-cost capital. The LTV is easy to calculate from the financial statement, as you only need 2 measures of data:

LTV = Mortgage Amount / FMV of properties

You don’t want to invest in a REIT showing a high LTV. This means that their credit rating may be at risk and the price for future debt will be higher. In other words, it could mean less money for future dividends.

Net Asset Value (NAV)

The last metric to follow for REITs is Net Asset Value (NAV), which (usually shown in units) is equivalent to a price-to-book ratio.

NAV = Total Property Fair Market Value – Liabilities

The idea is to compare a few REITs from your list against one another. This is how you should be able to find the ones with the best metrics. A lower than industry NAV is either a riskier play or a value play. The AFFO and LTV will tell you which one it is.

Avoid This Common REIT Mistake

REITs are required to distribute at least 90% of their taxable income to investors, which makes traditional payout ratios less useful. The metrics you’re looking for is the Funds From Operations (FFO) and the Adjusted Funds From Operations (AFFO) payout ratios.

Funds from Operations Payout Ratio

Formula: DIVIDEND PER SHARE (DPS) / (ADJUSTED) FUNDS FROM OPERATIONS (FFO) PER SHARE

Because of REITs’ tax structure, adjusted funds from operations (AFFO or FFO) is a more precise metric. Like the payout and cash payout ratio, it’s always preferable to look at a long-term trend of the metrics over several years.

Pros: Similar to the cash payout ratio, this ratio clearly shows how much cash the company has to pay dividends.

Cons: In most cases, you can’t calculate the FFO payout ratio yourself or find it on general finance websites. You must rely on the company’s information found in their quarterly earnings reports. It requires additional time to establish a trend over several years.

How to Value a REIT Like a Pro

Valuing a REIT is like valuing any stock.

I generally use the Dividend Discount Model (DDM) to value them. However, some of the other REIT-specific metrics we’ve seen are also very valuable when valuing REITs.

Net Asset Value (NAV) is another estimate of intrinsic value. It’s the estimated market value of the portfolio of properties. One way to evaluate this value is to divide the current net income from the properties by a capitalization rate that’s fair for those types of properties. NAV can potentially understate the value of the properties because it might not capture value appreciation of properties during strong growth periods in the market. Compare the NAV to the price of the REIT.

We’ve seen that Funds from Operations (FFO) are far more important than net income for a REIT. Due to the tax structure of REITs, earnings mean almost nothing; instead, it’s all about cash flow. When calculating net income, depreciation is subtracted from revenues; depreciation is a non-cash item and might not represent a true change in the value of the company’s assets. FFO adds depreciation back to net income, providing a better idea of the cash income for a REIT.

Adjusted Funds from Operation (AFFO) is arguably the most accurate income measurement metric for REITs. AFFO takes FFO but then subtracts recurring capital expenditures on maintenance and improvements. It’s a non-GAAP measure but a very good gauge of the actual profitability and amount of cash flow available to pay out in dividends.

Overall, it’s good to look for REITs that have diversified properties, strong FFO and AFFO, and a good history of consistent dividend growth.

REIT advantages and disadvantages

Before presenting some of our picks for Canadian REITs, let’s sum up the advantages and disadvantages of REITs.

Advantages:

  • Usually have above-average dividend yields.
  • Are good protectors from inflation. Property values and rents increase over time if inflation occurs, but fixed-interest on the debt that finances the properties doesn’t.
  • Real estate, if managed conservatively, can be a reliable investment for income and in times of recession, assuming tenants pay their rent.

Disadvantages:

  • Often have lower dividend growth than companies in other sectors.
  • Generally use debt to add to their property portfolio, but their larger debt loads is used for conservative, appreciating assets.
  • Since they have to pay most of their income as dividends, they have little downside protection from recessions. They might have to trim the dividend if their cash flow dips below their distribution levels. There are, however, some REITs that have good track records of consistent dividend growth, despite market downturns.

For example, Granite REIT has consistently used conservative debt and escalator leases to grow dividends. Conversely, Northwest Healthcare REIT stumbled due to poor balance sheet management, overreliance on floating rate debt, and deteriorating cash flow, leading to a dividend cut in 2023.

GRT.UN.TO vs NHW.UN.TO 5-Year Dividend Triangle.

REIT Summary or Quick Reference Table

✅ REIT Cheat Sheet
Best For: Income-focused investors, retirees.
Top Metrics: FFO/AFFO, NAV, LTV.
Risks: Overconcentration, debt levels, and tenant health.
Watch For: Dividend sustainability and inflation-adjusted leases.

Top REIT Picks

Below are some of my favorite REITs in Canada, side-by-side. You can also find a complete description for each in this article.

Our top 3 favorite monthly REITs using the Stock Comparison Tool at Dividend Stocks Rock.

Get More Stock Ideas: The Canadian Rock Stars List

Red star.

REITs can anchor your income portfolio — but they’re just one piece of the puzzle.

Explore our Canadian Rock Stars List to discover 300 dividend-growing stocks showing a positive dividend triangle (5-year revenue, earnings per share (EPS), and dividend growth trends) with filters.

Start your stock research on the right foot with the best Dividend Stocks List. Enter your name and email below.

Best Monthly REITs 2025

Retirement’s knocking — but can your income keep up? If you’re dreaming of monthly paychecks without the headaches of tenants or property repairs, Canadian REITs could be your answer.

Most dividends come quarterly. But some REITs? They pay monthly, giving you that steady stream of income retirees love.

What makes REITs great monthly payers?

While most companies pay dividends quarterly, many Canadian REITs opt for monthly distributions. That’s because their rental income arrives monthly — and they’re happy to share it.

Think of REITs like owning a rental empire — without the late-night repair calls. These trusts collect rent monthly from dozens (or hundreds) of properties and pass that income straight to you.

Monthly distribution REITs list

Monthly distribution REITs
Monthly distribution REITs in Calendar (for entertainment purposes only).

At DividendStocksRock, we track over 1,200 dividend-paying stocks. Only 65 Canadian companies pay a monthly dividend from this list, and over half (34) are REITs.

Want to explore all your monthly income options? Here’s our complete list of Canadian REITs that pay monthly dividends, including their yields and dividend growth history.

Retirees: Not All Income Is Created Equal

Monthly distributions can feel safe — until they’re not. High-yield funds often cut payouts when you need them most.

Dividend Income for Life shows you a better way:
✅ Reliable, growing income from quality dividend stocks
✅ A strategy built to outlast market dips and inflation
✅ How to retire with income you won’t outlive

💡 If you’re retired (or close to it), this guide is your roadmap to income that grows with you.

Download it free and build the income your retirement deserves.

Our Top 3 Monthly REITs

Some of the best Canadian REITs are paying a monthly distribution. We picked three standouts from over 30 monthly-paying REITs based on yield stability, tenant diversification, debt or payout ratios, and long-term growth.

Granite REIT (GRT.UN.TO)

GRT.UN.TO 5-Year Dividend Triangle.

Investment Thesis: Diversified, Disciplined, and Growing

Granite REIT has transformed from a single-tenant industrial landlord into a diversified, growth-oriented real estate investment trust.

Once dependent on Magna International for 98% of its revenue, that figure has dropped to 26.7% as of August 2024. The trust now owns 143 properties across seven countries, with a growing tenant base including Amazon. Backed by a BBB/BAA2 investment-grade rating and a low FFO payout ratio (~70%), Granite offers a 4–5% dividend yield with inflation-beating growth potential.

Strategic acquisitions and developments aligned with e-commerce and supply chain trends continue to fuel expansion and de-risk the portfolio.

Potential Risks: Magna Still Matters

Despite Granite REIT’s successful diversification, key risks remain—most notably its ongoing dependence on Magna, which still accounts for over a quarter of its revenue. Any disruption in Magna’s business could impact Granite’s financial stability.

Broader economic downturns could also reduce demand for industrial space, leading to lower occupancy and rent collections. Rising interest rates present a further challenge, potentially increasing borrowing costs and pressuring profit margins.

The industrial REIT space is also becoming increasingly competitive, with rivals like Dream Industrial and Stag REIT actively pursuing premium tenants and properties, requiring Granite to enhance its value proposition continuously.

CT REIT (CRT.UN.TO)

CRT.UN.TO 5-year Dividend Triangle.

Investment Thesis: High Yield, Low Risk, and Long Leases

CT REIT is a stable, income-focused real estate investment trust that derives 92% of its rental income from Canadian Tire and its associated brands.

With a robust 6.3% dividend yield and a conservative AFFO payout ratio (~74–75%), it offers reliable monthly income backed by long-term, triple-net leases. The REIT owns 375 properties across Canada and continues to grow through acquisitions, intensifications, and development projects.

While its fortunes are tied closely to Canadian Tire’s performance, the trust benefits from high occupancy, mission-critical assets, and strong pricing power on renewals—making it an appealing choice for conservative, yield-seeking investors.

Potential Risks: When Your REIT Depends on One Retailer

CT REIT’s stability comes with concentrated risk—over 90% of its leasable area is tied to Canadian Tire.

This tight dependency means the REIT’s fortunes rise and fall with its anchor tenant. While Canadian Tire has been resilient, any strategic shift or decline in its performance could have ripple effects on CT REIT.

The trust also faces exposure to interest rate risk due to its $3B+ in debt and operates many properties in secondary markets, which are more vulnerable during economic downturns.

Despite solid management and stable cash flows, CT REIT lacks diversification, making it a high-conviction bet on a single retailer.

Canadian Apartment Properties REIT (CAR.UN.TO)

CAR.UN.TO 5-year Dividend Triangle.

Investment Thesis: Stable Income with Rental Growth Upside

Canadian Apartment Properties REIT (CAPREIT) is a leading residential REIT with over 48,000 rental suites across Canada and the Netherlands.

Known for its inflation-resistant cash flows and strong occupancy (97.5% in Q4 2024), CAPREIT offers steady income and long-term growth potential. It has delivered high single-digit organic rent growth while engaging in capital recycling—selling nearly $1 billion in Canadian assets in 2024 to optimize its portfolio.

With strategic property acquisitions, strong demand in rental housing, and exposure to international markets, CAPREIT is well-positioned for continued performance amid a tight housing market and rising rental rates.

Potential Risks: From Strong Rents to Squeezed Margins

While CAPREIT remains a top residential REIT, it faces mounting headwinds from rising costs, regulatory risk, and economic uncertainty.

Same-property NOI growth slowed to 3.4% in Q4 2024, as maintenance and repair expenses climbed. A potential shift in Canadian immigration policy could weaken rental demand, while high interest rates continue to pressure REIT valuations and acquisition strategies.

CAPREIT also competes with other major residential REITs and faces new risks through its European exposure, including currency volatility and unfamiliar regulatory landscapes.

Future performance will depend on its ability to maintain occupancy, control costs, and adapt to a changing macro environment.

Each REIT has strengths — whether it’s Granite’s industrial edge, CT’s retail consistency, or CAPREIT’s rental growth. Consider what fits your income goals and risk comfort.

Those REITs are great, but there’s more!

Monthly REITs are a powerful tool — but they’re not the whole picture. Relying solely on high yields can be risky, especially if payouts get slashed.

That’s why we built ‘Dividend Income for Life’ — a strategy that balances immediate income with long-term stability.

Discover the Dividend Strategy Built for Real, Long-Term Income

If you’re counting on monthly distributions to fund your retirement, there’s something you need to know: many of them aren’t sustainable. High yields can vanish overnight with a dividend cut — leaving your income and peace of mind at risk.

That’s where Dividend Income for Life comes in.

This free guide reveals a disciplined, proven strategy to build income from dividend stocks that grow over time — not just pay today.

Inside, you’ll learn:

✅ Why monthly income funds can be misleading (and what to use instead)
✅ The secret power of low-yield, high-growth stocks to protect your income
✅ How to build a portfolio that grows your cash flow and preserves your capital
✅ Real data: how dividend growers crushed high-yield stocks over the last decade
✅ A smarter withdrawal approach to make your money last

🛡️ Don’t trade short-term comfort for long-term risk.
Build a dividend income stream designed to last – and grow – for life.

👉 Download your free copy now and take control of your retirement income.

Canadian Dividend Aristocrats 2025

We look at the Canadian Dividend Aristocrats for 2025, what they are, who they are, and why they matter to dividend growth investors. See some of our favorite aristocrats and why we like them, and learn where to find stocks that are right for you.

What’s a Canadian Dividend Aristocrat?

It’s a Canadian company showing five consecutive years with a dividend increase. Aristocrats are solid companies with a robust balance sheet.

Why do they matter to you?

Dividend growers tend to outperform the market over a long period, and with less volatility. Dividend growers = more money and less stress. Investing in Canadian dividend growers should lead to recurrent investment income and help you achieve your retirement goals.

Can you invest in any Canadian Dividend Aristocrat and make money?

NO. This guide to Canadian Dividend Aristocrats provides you with a list of stocks and a methodology to select the right companies for your portfolio. We also share our favorite Canadian aristocrats.

Canadian Aristocrats and U.S. Aristocrats

The Canadian Dividend Aristocrats list is the little brother of a much more extensive and world-known dividend growers list. The popular U.S. Dividend Aristocrats List includes companies with over 25 consecutive years of dividend increases. What about Canadians? Do we have companies showing 25+ years of consecutive dividend increases?

While Canada has a few companies that achieved that feat, the Canadian Dividend Aristocrats list would be too short if we included them using the US requirement. Canadian aristocrats are companies that increased their dividends for at least five consecutive years.

While many investors might think 5 years is insufficient to give such an elite title to a company, I disagree. I love picking stocks that have just started increasing their dividends on their way to a great future. It’s a unique opportunity to select high-quality companies and enjoy stock price appreciation. We all wish we had bought shares of Coca-Cola (KO) 50 years ago when it was a young dividend grower. You have a similar opportunity with the Canadian dividend aristocrats.

Skip to the Good Stuff: Canadian Rock Stars List

Don’t get me wrong, I like the Canadian Aristocrats and will share more about them below. However, I believe there’s a better way to select dividend growers that will thrive for decades.

Red star.

I have created a list showing about 300 companies with growing revenue, earnings per share (EPS), and dividend growth trends. Focusing on trends rather than numbers gives you a better perspective on past, present, and future growth.

The Dividend Rock Stars List is the best place to start your stock research. Get it for free by entering your name and email below.

What it Takes to Become a Canadian Dividend Aristocrat?

Canadian companies don’t have to show 25 years of consecutive dividend increases, unlike U.S. aristocrats. Even the 5-year minimum requirement isn’t as strict as you might think. The requirements Canadian companies must meet to earn the title are:

  • The company’s common stock is listed on the Toronto Stock Exchange (TSX) and is a constituent of the S&P BMI Canada. Stocks listed on the TSX Venture aren’t eligible.
  • The company’s market capitalization (Float-adjusted) is at least $300M. We want companies of a minimal size. Yet $300M is relatively permissive.
  • The company increased its regular cash dividends for five consecutive years, but companies can pause their dividend growth policy for a maximum of 2 years within said 5-year. In other words, if the company intends to share the wealth, it has a good chance of being included among the elite dividend growers.

Needless to say, it’s easier to become a Canadian aristocrat than a U.S. aristocrat! To do that, U.S. companies must:

  • Be a member of the S&P 500.
  • Show 25+ consecutive years of dividend increases.
  • Meet specific minimum size & liquidity requirements.

It would be foolish to think that any aristocrat out of the list makes a good investment. We regularly see companies added or withdrawn from the list on both sides of the border. The list you see in 2025 shows only those who survived the test of time.

Canadian Dividend Aristocrats for 2025

There are 92 Canadian dividend aristocrats in 2025. You’ll find very few Technology companies as that sector is not known for steady cash payments to shareholders. However, you’ll see many Financial Services and Industrials companies. Those two sectors have been and continue to be well-established dividend payers in Canada.

As shown below, half the Canadian dividend aristocrats are in the Financials, Industrials, and Real Estate sectors and about 22% are in the Communication Services and Utilities sectors. Industrials, Consumer Staples, Consumer Discretionary, and Materials each represent 4% to 9% of aristocrats. There are none in healthcare.

CDN Aristocrats Sector Allocation. Source: BlackRock

Here are the Canadian dividend aristocrats as of 2025, grouped by sector.

Core Sectors

Financials

Bank of Montreal (BMO.TO) Intact Financial (IFC.TO)
Brookfield Asset Management (BAM.TO) Manulife (MFC.TO)
Brookfield Corp (BN.TO) National Bank (NA.TO)
CIBC (CM.TO) Power Corporation (POW.TO)
Equitable Group (EQB.TO) Royal Bank (RY.TO)
Fiera Capital Corp (FSZ.TO) ScotiaBank (BNS.TO)
First National Financial (FN.TO) Sun Life Financial (SLF.TO)
Great West Life (GWO.TO) TD Bank (TD.TO)
Industrial Alliance (IAG.TO) TMX Group (X.TO)

Consumer Staples

Alimentation Couche-Tard (ATD.TO) Maple Leaf Foods (MFI.TO)
Empire Co (EMP.A.TO) Metro (MRU.TO)
George Weston (WN.TO) Premium Brands (PBH.TO)
Jamieson Wellness (JWEL.TO) Saputo (SAP.TO)
Loblaw (L.TO) The North West Company (NWC.TO)

Information Technology

Enghouse Systems (ENGH.TO)
Open Text Corporation (OTEX.TO)

Growth Sectors

Industrials

ADENTRA (ADEN.TO) Hammond Power Solutions (HPS.A.TO)
Aecon Group (ARE.TO) Savaria Corporation (SIS.TO)
Badger Daylighting (BDGI.TO) Stantec (STN.TO)
Boyd Group Services (BYD.TO) TFI International (TFII.TO)
Canadian National Railway (CNR.TO) Thompson Reuters (TRI.TO)
Cargojet (CJT.TO) Toromont Industries (TIH.TO)
Exchange Income Fund (EIF.TO) Waste Connections (WCN.TO)
Finning Intl (FTT.TO)

Consumer Discretionary

Canadian Tire Corporation (CTC.A.TO) Magna International (MG.TO)
Dollarama Inc (DOL.TO) Restaurant Brands International (QSR.TO)

Income sectors

Real Estate

Allied Properties REIT (AP.UN.TO) InterRent REIT (IIP.UN.TO)
Canadian Apartment Properties REIT (CAR.UN.TO) Killam Apartment REIT (KMP.UN.TO)
CT REIT (CRT.UN.TO) Minto Apartment REIT (MI.UN.TO)
FirstService Corp (FSV.TO) Storagevault Canada (SVI.TO)
Granite REIT (GRT.UN.TO)

Utilities

AltaGas (ALA.TO) Fortis (FTS.TO)
Atco (ACO.X.TO) Hydro One (H.TO)
Canadian Utilities (CU.TO) TransAlta Corp (TA.TO)
Emera (EMA.TO)

Communication Services

BCE (BCE.TO) Quebecor (QBR.B.TO)
Cogeco (CGO.TO) Telus (T.TO)
Cogeco Cable (CCA.TO)

Volatile Sectors

Materials

Altius Minerals (ALS.TO) Stella-Jones (SJ.TO)
CCL Industries (CCL.B.TO) West Fraser Timber (WFG.TO)
Franco-Nevada Corp (FNV.TO) Wheaton Precious Metals Corp (WPM.TO)
Nutrien (NTR.TO)

Energy

Canadian Natural Resources (CNQ.TO) Parkland Corporation (PKI.TO)
Enbridge (ENB.TO) Pembina Pipeline (PPL.TO)
Gibson Energy (GEI.TO) South Bow (SOBO.TO)
Imperial Oil (IMO.TO) TC Energy (TRP.TO)
North American Construction (NOA.TO) Tourmaline Oil (TOU.TO)

Even Better than an Aristocrat?

At Dividend Stocks Rock (DSR), we go further with our Canadian Rock Stars list, which we update and publish monthly. That list is even stronger than the Canadian Dividend Aristocraft list because we look beyond dividend growth. It is based on a combination of three metrics that I call the Dividend Triangle.

To be on the Rock Stars list, companies must show dividend, revenue, and EPS growth over 5 years. Growing revenue and profits fuel future dividend increases and make them more secure.

This simple focus on three metrics reduces your research time and helps you find companies with robust financials. Many aristocrats are on the Rock Star list, but not all. Also, the list includes many additional metrics and filters to help you narrow your search.

Download the Canadian Rock Stars list. We update it monthly!

Top 3 Canadian Dividend Aristocrats 2025

Using the methodology above, I’ve selected my favorite Canadian Aristocrats, who are also DSR Canadian Rock Stars.

Alimentation Couche-Tard (ATD.TO)

ATD.TO 5-Year Dividend Triangle.

Investment Thesis: Big Dividends and Bigger Acquisitions

In the long term, dividend payouts should grow in the double digits, and investors should see strong stock price growth. ATD’s potential is directly linked to its capacity to acquire and integrate additional convenience stores. Management has proven its ability to pay the right price and generate synergies for each acquisition. ATD exhibits a solid combination of the dividend triangle: revenue, EPS, and strong dividend growth. The company counts on multiple organic growth vectors such as Fresh Food Fast, pricing & promotion, assortment, cost optimization, and network development. ATD has a growth plan (10 for the win) to generate over $10B in EBTIDTA in 2028. This includes a mix of organic growth and acquisitions.

In 2023, ATD confirmed the acquisition of 2,193 stores from TotalEnergies for €3.1B (100% of retail assets in Germany and the Netherlands and a 60% controlling interest in the Belgium and Luxembourg entities). This will significantly expand ATD’s exposure to the European market and increase its total number of stores to surpass 16,000 worldwide.

ATD Eyes 7-Eleven: A Game-Changer or a Waiting Game?

In mid-2024, the company announced its intention to acquire Seven & I (7Eleven), the world’s largest (by number) convenience store operator. We are still in the first innings of this soap opera, and nothing is telling us there will be an agreement. 7-Eleven is playing hard to get. You are better off waiting to see if an accepted deal is on the table before calculating the future debt ratio!

Potential Risks: Expansion Challenges

Growers by acquisition are all vulnerable to occasionally making a bad purchase. While ATD’s method of acquiring and integrating more convenience stores has proven successful, it is essential for them not to grow too fast or become too eager, leading to possibly overpaying in the name of growth. The company exhibited this when it tried to acquire the French grocery store Carrefour. Still, we don’t think the next acquisition should be a source of concern with the current management team. The company is back into another drama with its will to acquire 7-Eleven.

EV Disruption, Declining Tobacco Sales & Economic Uncertainty

Investors are also worried about the potential impact of electric vehicles on fuel sales, but we believe ATD will overcome this challenge by installing superchargers. Another secular trend is the decline in cigarette sales. ATD sells a lot of tobacco and alcohol products. It must shift its product offering toward food and fresh produce (that’s already the plan).

Finally, the economy impacts ATD’s revenue and earnings. In 2024, we saw a weakening dividend triangle, which has started to raise concerns from the most pessimistic investors.

Fortis (FTS.TO)

FTS.TO 5-Year Dividend Triangle.

Investment Thesis: A Powerhouse in Growth & Dividends

Fortis invested aggressively over the past few years, resulting in solid growth from its core business. An investor can expect FTS’ revenues to grow as it expands. Bolstered by its Canadian-based businesses, the company has generated sustainable cash flows leading to four decades of dividend payments. The company has a five-year capital investment plan of approximately $25 billion between 2024 and 2028. This plan is  $2.7 billion higher than the previous five-year plan. The increase is driven by organic growth, reflecting regional transmission projects for several business segments. Only 33% of its CAPEX plan will be financed through debt, while 61% will come from cash from operations. Chances are that most of its acquisitions will happen in the U.S. We also like the company’s goal of increasing its exposure to renewable energy from 2% of its assets in 2019 to 7% in 2035. FTS reported Capital expenditures of $2.3 billion in the first half of 2024, keeping its $4.8 billion annual capital plan on track.

Investing Big in U.S. Transmission & Renewables

Fortis is advancing its strategic initiatives by focusing on regulated growth and sustainability. The company is progressing with key transmission investments, including the MISO Long-Range Transmission Plan, where ITC expects at least $3 billion in capital investment for projects in Michigan and Minnesota. Fortis is also exploring opportunities to expand and extend growth beyond the current capital plan, with potential investments in renewable gases and transmission projects supporting the delivery of offshore wind.

Potential Risks: Interest Rates, Regulations & Currency Risks

Fortis remains a utility company; in other words, don’t expect astronomical growth. However, Fortis’ current investment plan is enough to make investors smile. Fortis made two acquisitions in the U.S. to perpetuate its growth by opening the door to a growing market. However, it may be difficult for the company to grow to a level where economies of scale would be comparable to that of other U.S. utilities. The risk of high prices for other U.S. utilities is also present. Fortis runs capital-intensive operations, making its business model sensitive to interest rates. Finally, as most of its assets are regulated, each increase is subject to regulatory approval. While FTS has a long history of negotiating with regulators, demand for rate increases may be revised. Please also note that Fortis’ revenue is subject to currency fluctuations between the CAD and USD currencies.

National Bank (NA.TO)

NA.TO 5-Year Dividend Triangle.

Investment Thesis: Winning Formula – Diversification, Acquisitions & Strong Dividends

NA has targeted capital markets and wealth management to support its growth. Private Banking 1859 has become a serious player in that arena. The bank opened private banking branches in Western Canada to capture additional growth. The bank now shows great diversification across its various business segments (with 50% of its revenue outside of classic savings & loans activities). Since NA is heavily concentrated in Quebec, it concluded deals to provide credit to investment and insurance firms under the Power Corp. (POW). In 2024, National Bank announced the acquisition of Canadian Western Bank (CWB.TO) for $5B. The deal is not closed yet (it is expected to close only at the end of 2025). If it happens, it will boost NA’s presence in Western Canada and open the door to more cross-selling opportunities amongst this new book of clients, as CWB doesn’t currently offer a service such as Private Banking 1859.

From Quebec to Cambodia

The stock has outperformed the Big 5 for the past decade as it has shown strong results. National Bank has been more flexible and proactive in many growth areas, such as capital markets and wealth management. Currently, NA is seeking additional growth vectors by investing in emerging markets such as Cambodia (ABA bank) and the U.S. through Credigy. We wonder if it can achieve more success than BNS on international grounds. This is one of the rare Canadian stocks having a near-perfect dividend triangle.

Potential Risks: Market Volatility & Economic Shifts

National Bank is still highly dependent on Quebec’s economy, as about half of its revenue comes from this province. As a hyper-regional bank, NA is more vulnerable to local economic events. This has not affected the bank significantly, but we advise keeping track of its credit loss provisions. Recessions and rising interest rates could also affect the bank’s debt portfolio. Financial markets’ revenues are also highly volatile. We often mention that financial markets could save or wreck the day–NA may experience a bad quarter if the stock market becomes bearish.

Overall, the bank has performed very well, but it usually takes more risk to identify growth vectors (such as the ABA bank investment and capital markets). So far, it has paid off, but it does not mean it will always be this way. Remember that investments in emerging markets are unpredictable and could shift very quickly.

Get More Stock Ideas: The Canadian Rock Stars List

Red star.

Are you curious about the other Rock Stars on the list? Access to about 300 companies showing a positive dividend triangle (5-year revenue, earnings per share (EPS), and dividend growth trends) with filters.

Start your stock research on the right foot with the best Dividend Stocks List. Enter your name and email below.

Best Canadian Stocks to Buy in 2025

Most of the best Canadian stocks pay a dividend. Known for their stability when markets are rough, they also provide income to investors quarterly. Companies in sectors such as utilities, REITs, and banks can protect you against market fluctuations and severe losses.

Yet, not all dividend-paying companies are good investments. Investing in dividend stocks can lead to painful losses and income cuts. The risk of falling for dividend traps or seeing your retirement income plummet due to the wrong stock selection is too frequent.

The market creates bubbles and hurts your portfolio. You worked hard to invest money, and you shouldn’t lose it to the wolves of Bay Street. There is a way you can invest safely in Canadian dividend stocks. We have selected some high-quality stocks to make your life easier.

Best Canadian Dividend Stocks for 2025

When I built my retirement portfolio, I focused on companies showing a combination of safe income and steady growth. My choices include Canadian Dividend Aristocrats (companies showing several years of consecutive dividend increases). I added a few more metrics and used the DSR stock screener to refine my research.

Here are some of the best Canadian Dividend Stocks for 2025:

#10 Telus (T.TO)

#9 Granite REIT (GRT.UN.TO)

#8 Hydro One (H.TO)

#7 Dollarama (DOL.TO)

#6 Canadian Natural Resources (CNQ.TO)

#5 CCL Industries (CCL.B.TO)

#4 Brookfield Corp (BN.TO)

#3 Brookfield Renewables (BEPC.TO)

#2 National Bank (NA.TO)

#1 Alimentation Couche-Tard (ATD.TO)

More Stock Ideas and Sectors’ Insights

Unlock More Dividend Growth Picks

Red star.If you want more hand-picked dividend growers across industries, grab our Dividend Rock Star List.

It features around 300 stocks with complete Dividend Safety Scores, growth projections, and buy lists tailored for retirement portfolios.

Most importantly, it is the ONLY list using the Dividend Triangle as its foundation.

#10 Telus (T.TO)

About a year ago, Telus was upgraded to a PRO rating of 5. I thought the company would bounce back faster, but it wasn’t the case. My long-term view of Telus hasn’t changed, though.

While the company reported modest revenue growth throughout the year, its cash flow metrics (cash flow from operations, free cash flow and capital expenditure) have improved significantly. The company is covering their dividend from free cash flow and interest charges are under control.

It took longer than expected, but I believe Telus will get out of this rut and make investors happy. It’s only a matter of time.

#9 Granite REIT (GRT.UN.TO)

Granite is a very frustrating REIT to hold. I love the investment thesis which includes the strong need for industrial properties, GRT’s ability to grow its business while growing FFO per unit and distribution increases intact and the high occupancy rate. The financial metrics back this investment thesis as revenue, Funds from operations, FFO per units, payout ratio and occupancy rate are all looking good. Why is GRT frustrating to hold? Because it simply doesn’t get any love from the market. Despite its good numbers, GRT lags the market and fails to generate positive returns.

With a low FFO payout ratio (68% for the first 9 months of 2024), shareholders can enjoy a 4.5% yield that should grow and match (or beat) the inflation rate. This is among the rare REITs exhibiting AFFO per unit growth while issuing more units to finance growth.

#8 Hydro One (H.TO)

From time to time, I hear that Hydro-Quebec should go public and unlock tons of value. However, I understand the government’s provincial point of view of keeping this amazing asset for themselves. Do you know why? Because Hydro-Quebec pays a generous dividend to the government each year!

Well, Hydro One is in a similar situation but you have the possibility of getting a piece of the cake as the Ontario Government decided to sell a part of its stake in this beauty. With 99% of its operations being regulated and 98% of its electric lines being in Ontario, an investment in Hydro One is a pure play on Ontario’s power development. This is the pure definition of a sleep-well-at-night investment. The company expects to invest $1.3B to $1.6B in CAPEX yearly until 2027 which will support their EPS growth guidance of 4-7% and dividend growth of about 5%. The province enjoys a strong and diversified economy and Hydro One will continue to grow by walking in the province’s path.

#7 Dollarama (DOL.TO)

Dollarama storefront sign

I’m kicking myself for not having Dollarama in my portfolio. Maybe in another life!

DOL has built a strong brand, and its business model (aimed at low-value items) is an excellent defensive play against the e-commerce threat over the retail business. As consumers’ budgets are tight, DOL appears to be an amazing alternative for many goods. Dollarama has been able to increase same store sales along with opening new stores consistently. The introduction of many products under its “home brand” increases the company’s margin. DOL introduced a new price point of $5 for many items, which lends additional flexibility and pricing power.

#6 Canadian Natural Resources (CNQ.TO)

CNQ is a rare beast in its environment that has increased dividends for 25 consecutive years. Yes, it even increased its payouts while everybody was on hold or cutting distributions in 2020. It brings the question: why is CNQ “oil price resistant”?

The company is sitting on a large reserve of cheap oil. According to management, CNQ is profitable with an oil price per barrel of around $35-$40. This enables the company to manage production and capex with greater flexibility. They can then slowdown CAPEX when the oil price is low and produce less. When we are in “full oil bull mode”, CNQ bolsters CAPEX and boosts production generating maximum cash flow. This is exactly what just happened where CNQ dropped its debt and now focuses on rewarding shareholders with share buybacks and dividend increases.

To be clear, I don’t see CNQ as a super powered growth stock for the future. However, with a yield above 4% and a resilient business model, that’s the type of business that will either be very good in your portfolio, or it will go back into hibernation mode paying a secure dividend. In both scenarios, you can be a winner over the long run.

#5 CCL Industries (CCL.B.TO)

Finding an international leader with a well-diversified business based in Canada is rare. Through the major acquisition of business units from Avery (world’s largest supplier of labels) in 2013, the company has set the tone for several years of growth. Bolstered by its previous successes, CCL also bought Checkpoint, a leading developer of RF and RFID, and Innovia in the past few years and announced more acquisitions in 2021. The company is still able to generate organic growth (roughly 4-5%) on top of its growth through acquisitions.

#4 Brookfield Corporation (BN.TO)

I’m keeping BN among my top picks for a third year in a row. The 2024 selection paid off as Brookfield skyrocketed with more than 50% return. I think there is much more to come! Brookfield is amongst the largest players in alternative asset management. As the stock market looks overvalued, many investors will turn toward alternative assets as a way to generate profits and hedge their bets. Those long-term assets require patient capital and a high level of expertise. Brookfield is in a perfect position to provide this service to investors. Even better, BN invests its own capital in many projects. Therefore, it can double-dip by charging a fee on managed capital and making capital gains when selling assets.

#3 Brookfield Renewables (BEPC.TO)

BEP enjoys large-scale capital resources and has the expertise to manage its projects across the world. Management aims for a 5-9% annual distribution increase, backed by double-digit guidance that includes a mix of organic and M&A growth. Investors gravitate toward clean energy, and BEP is well-positioned to attract them.

Following an impressive stock price surge through 2020, the stock has been trending down for the past two years, although there is nothing to worry about. The rise of interest rates on bonds combined with the incredible ride BEP has had is responsible for this correction. In late 2023, management reaffirmed its strong position and ability to generate strong returns over the long haul. The latest results in early 2024 confirmed that BEP is still focused on growth opportunities. In Q2 of 2024, management highlighted the important contract signed with Microsoft to supply 10.5GW to support MSFT’s AI and cloud business energy needs. This could open the doors to more deals with corporations in the future.

#2 National Bank (NA.TO)

National Bank logo

There is no secret here as I’m a National Bank fan. It seems that the bank has done everything right over the past 15 years. This big transformation converted a small provincial bank into a serious player in capital markets and the private wealth industries. The Bank is expected to complete a key acquisition of Canadian Western Bank in 2025 which will bring more capital onto its balance sheet (supporting capital market lucrative operations), more synergies (high cross-selling opportunities between CWB’s commercial clients and private wealth management) and a good presence in Western Canada. NA is also doing very well in Cambodia (Aba Bank) and through its door into the U.S. (Credigy).

#1 Alimentation Couche-Tard (ATD.TO)

I might never have another choice for Canadian than Couche-Tard. I’ve looked at grocery stores, but Metro (MRU.TO) and Loblaws (L.TO) don’t offer many growth opportunities. Don’t get me wrong, they are great companies, but I think ATD will do better.

Things are changing quickly around the 7-Eleven deal. ATD has tried to get to the negotiation table to acquire 7-Eleven for a few months now. The Japanese company is trying all means to stay Japanese. The latest chatter was that the son’s founder would buy it back and make it private. The market liked the idea, and the ATD share price rose again. This story isn’t over yet one way or another.

For 2025, I see ATD striking another acquisition. After all, it’s in its DNA. If it’s not 7-Eleven, it will be another chain (maybe Casey’s?… it tried to acquire CASY in 2010). ATD must gain more expertise in growing organically through the sale of read-to-eat and fresh produce. This is how they can mitigate the impact of slowing fuel and tobacco sales over the next 10-20 years.

Unlock More Dividend Growth Picks

Red star.If you want more hand-picked dividend growers across industries, grab our Dividend Rock Star List.

It features around 300 stocks with complete Dividend Safety Scores, growth projections, and buy lists tailored for retirement portfolios.

Most importantly, it is the ONLY list using the Dividend Triangle as its foundation.

  • Page 1
  • Page 2
  • Page 3
  • Interim pages omitted …
  • Page 5
  • Go to Next Page »

Copyright © 2025 · Moose Markets