Quarterly review of your stocks made easy! That’s what I aim to do in this post. Reviewing your holdings’ quarterly results and your reasons for holding each stock to begin with are essential. It makes you confident that you have a resilient portfolio that suits your needs and that protects your retirement.
Finding the information
You’ll find most of the information you need in the companies’ quarterly results press releases. You can also look at their quarterly reports, management discussion and analysis (MD&A), and filing documents. Go to each company’s website, in the Investor Relations section. Dividend Stocks Rock members get links to the press releases in their quarterly reports and see trends for many metrics on stock cards.
Create a recession-proof portfolio and secure your retirement. Download our free workbook!
Trends and anomalies
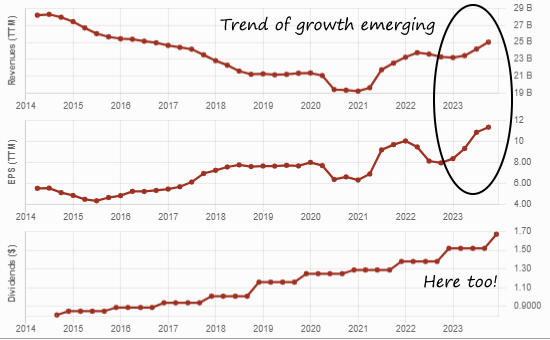
Reviewing results isn’t simply checking that sales and profits grew compared to last year. You must also look at the trends, i.e. the evolution of revenue, profit, dividend, etc., over time to see whether the company consistently succeeds. The trend is your friend. Also, when results show something unusual, going against the trend, investigate.
For example, you see a sharp drop in sales for a company that has increased its sales every quarter over five years. Do you panic and sell the stock? No, you investigate to see if it’s a temporary setback. Maybe the company had to shut down production when a storm damaged its facility or a ship stuck in the Suez Canal led to a shortage of raw materials.
Revenue growth
In the most recent quarterly results, look for the company’s revenue or sales. Revenue includes money made from sales and other sources, such as investment income.
1 – Compare the revenue number with the comparable period, also called the year-ago period. This is the same period of the year but a year ago. If you’re looking at Q2 revenue, compare it with Q2 revenue from a year ago.
2 – Has the revenue grown, is it flat with last year’s, or has it decreased? By how much in percentage?
Generally, 1% isn’t much, single-digit growth or decline is moderate, while double-digit growth (10% and more) is solid. Of course, that varies across industries and companies; 10% growth in a quarter for a company will disappoint if it had been growing its sales by 20% every quarter for two years.
3 – Look at the company’s quarterly revenue trend over five years. Does the trend show growth over five years? It is steady growth or accelerating? Is the trend showing a decline?
Is the most recent revenue figure within the trend or is it unusually good or bad? If it’s unusual, investigate the cause. The press release often explains exceptional conditions or one-time events that caused an anomaly.
Profit Growth
You also compare the company’s profit with that of the prior-year period. The profit is called net income or net earnings. The easiest metric to use for profits is the Earnings per Share (EPS) metric. EPS is a metric that divides the company profits by the number of shares.
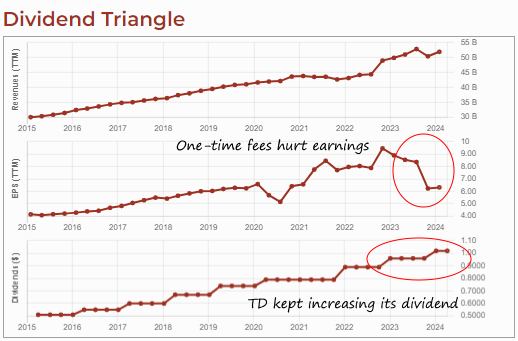
One-time or unusually large expenses, for example, a lawsuit settlement or a product recall, affect EPS. Companies often provide another metric called the Adjusted EPS (or normalized) that excludes such unusual items to provide a value that is more comparable to that from the prior-year period.
1 – Observe whether the EPS (or Adjusted EPS) has grown, is flat, or has decreased, and by how much in percentage.
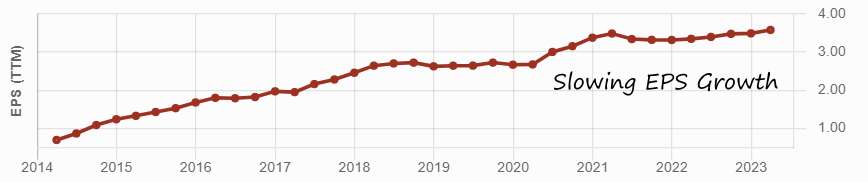
2 – Look at the EPS trend over five years. Is the company growing its profits, is it stagnating, or in decline? Is EPS growth or decline steady or accelerating?
Accelerating growth hints at a thriving company that executes well while an accelerating decline is a problem.
3 – Are the most recent EPS within the trend or unusual? For unusual EPS, investigate.
If there was a sharp sales drop, EPS falling is not surprising. If EPS falls more than sales or falls while sales increase, perhaps the company costs have risen due to inflation, shortages, etc. Maybe the company lowered its prices to customers to drive up sales, reducing profit margins at the same time.
For some industries with large amounts of depreciation, such as utilities and REITs, EPS can be misleading. Other metrics such as distributable cash flow (DCF) per share or funds from operations (FFO) per share are more appropriate.
Dividend Growth and Safety
Compare the most recent dividend amount paid or announced with the dividend paid in the previous sequential quarter, i.e., when looking at the Q3 dividend, compare it to Q2 rather than Q3 of the previous year.
1 – Has the dividend increased? Is it the same? Was it cut? I usually don’t hold on to companies that cut their dividends.
2 – If there wasn’t a dividend increase, look at the dividends paid over the last 12 months; was there an increase in the last year? A yearly dividend is a minimum for a dividend growth investor.
3 – How much was the dividend increase in percentage? Does it at least match inflation? Companies that don’t consistently match or exceed inflation don’t protect your income in the future.
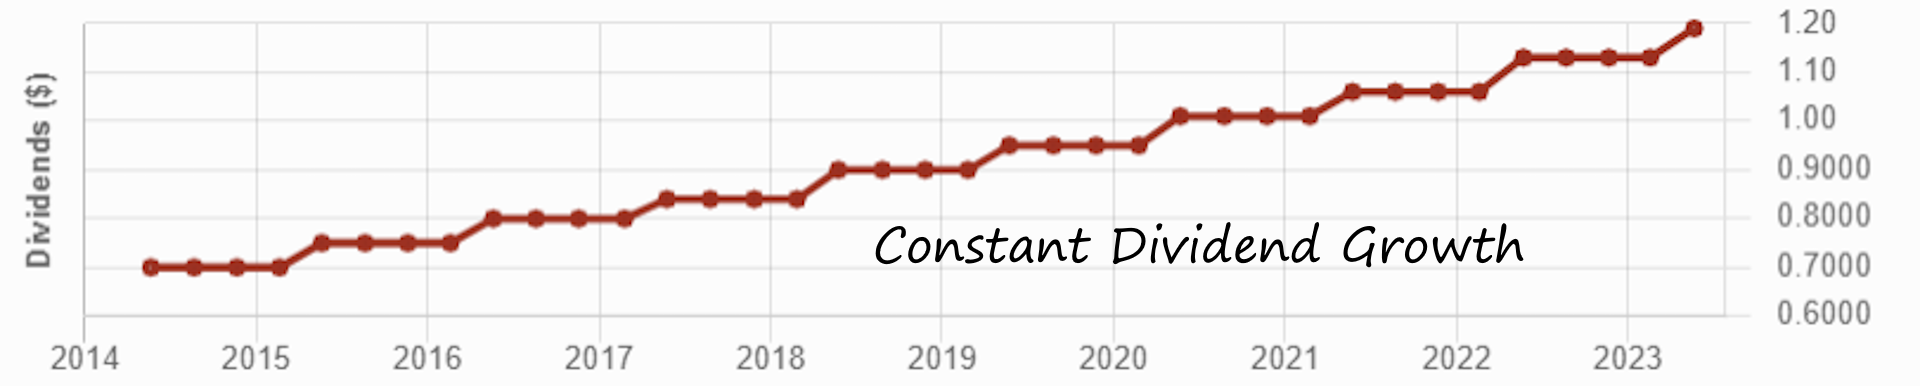
4 – Look at the dividend trend over five years. Is there yearly growth? Is growth accelerating, steady, or slowing down? Often, dividend growth that slows down is the first sign of a dividend cut in the future.
5 – Look at the company’s payout ratio. This ratio identifies how much of the profits the company pays out in dividends. We all want generous dividends, but if a company pays more than it earns, that’s not sustainable. Compare the latest payout ratio with the payout ratio trend over five years to see whether it is normal for this company, higher or lower. You might also want to look at the cash payout ratio; for some industries, you should look at other payout ratios that are more appropriate.
6 – Look at the company’s cash from operations amount and see the five-year trend. Companies that generate increasing amounts of cash from operations are in a good position to keep paying and increasing their dividends.
We’re here to help! Download our free recession-proof portfolio workbook!
Company’s future
Now that you know how a company performed and how it’s evolving, look at what’s in store for that company in the future. Will it be able to keep growing for years to come? Are there risks heading its way? Some things to look for include:
- Mergers and acquisitions that bring challenges but also growth opportunities.
- Company getting rid of non-productive assets or brands to improve their future results.
- Announcements about new products, expansion in new markets or business areas.
- Capital expenditures (CAPEX) invested in infrastructure; is it likely to bring revenue growth?
- The company’s outlook for the full year, or the new year.


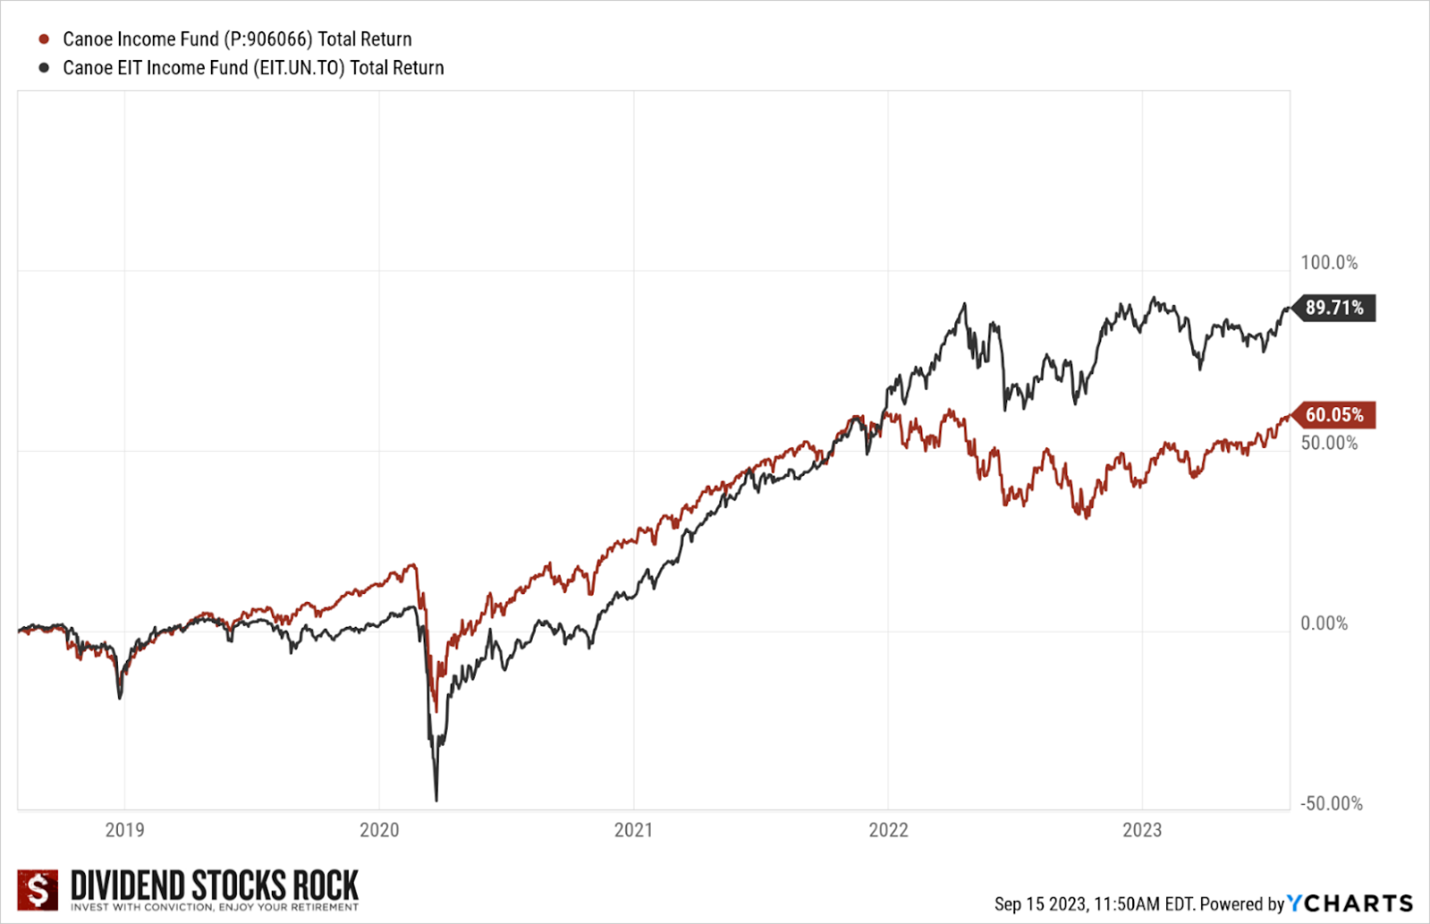
 Financial companies, like asset managers, make fees based on the amount of Assets Under their Management (AUM). The higher the AUM, the higher the revenue and profit. Retirees are very profitable customers for these companies because of their sizeable savings, often in the hundred of thousands, that make growing AUM a lot easier than millennials investing much less. What do retirees want? Income!
 Financial companies often use a mix of options strategies to create income; you must understand what you’re investing in. You’ll have to read pages of boring stuff, and don’t stop at the description either!
 Unlike the Canada Pension Plan (CPP) and the Quebec Pension Plan (QPP/RRQ), the OAS is not a pension to which you and your employer(s) contribute over the years. OAS payments come from the taxes the federal government collects each year.
 The amount of the OAS payment depends on how long you have lived in Canada since the age of 18, and the age when you start receiving the payment. Your OAS monthly payment increases by 10% when you turn 75 years old.
 You can delay receiving OAS payments until the age of 70. For every month after your 65th birthday that you delay receiving your first OAS payment, the government increases the amount you will receive by 0.6%, or 7.2% per year.