Worried about holdings that show a weak dividend triangle? Revenue and EPS are falling, dividend growth is slowing down, or worse absent. What do you do? Last week we explored how to analyze falling revenue in a weak dividend triangle. Now we look at interpreting weak EPS and dividend growth.
In last week’s article, we explained the importance of putting metrics fluctuations in context and that the trend is your friend, meaning you must look at the evolution of metrics over time to understand what’s going on. Missed it? Read it here.
When earnings per share (EPS) are down
Earnings going down means the company is making less profit, not something that you like to see. Again, however, you must put that in context.
First, understand where that number comes from. EPS is based on accounting principles. Consequently, major events like impairments, one-time charges for an expansion and acquisition, and amortization impact the EPS even though these events aren’t necessarily bad things. Seeing the EPS go down raises a flag regardless, and it must be investigated. Reviewing the trend in Adjusted EPS (also called non-GAAP) can help here because one-time charges and amortization are not included.
Companies that make a lot of investments in assets or infrastructure have a lot of amortizations, and their EPS fluctuation often causes confusion.
Example: Brookfield Corporation (BN.TO / BN)
Recently, at the same time Brookfield Corporation (BN)’s EPS was going down, it announced a generous dividend increase. A business whose profit is plummeting is raising its dividend. “I’m losing my job I think I’ll buy a car.” It doesn’t make sense.
Since BN makes a lot of investments, it’s better off to look at funds from operation (FFO) and FFO/share rather than EPS. The FFO/share is at homemade metric and is not always easy to find. Financial websites show the adjusted EPS or EPS; digging into the quarterly statements and investor presentations will give you the correct picture. For Brookfield, they showed a company that’s growing and thriving, but EPS isn’t showing that profit yet.
Find stocks with a strong dividend triangle from our Rock Stars list, updated monthly!
Example: TD Bank (TD.TO /TD)
Another example from last year was TD Bank which had lots of one-time fees in its financial statements.
- Fees for TD’s decision to abort the acquisition of First Horizon, a prudent move in light of many U.S. regional banks having problems with their balance sheets, and some of them going bankrupt in 2023.
- The FDIC, which ensures deposits in the US, requested a special assessment of all banks in the U.S. As TD does a lot of business there, it spent $100M for FDIC assessment, passing the stress test and proving it’s well capitalized and has a robust balance sheet
- Due to the economy, all banks had to raise their provisions for credit losses.
Combining these three unrelated factors hurt the EPS, whose trend doesn’t look sharp right now.
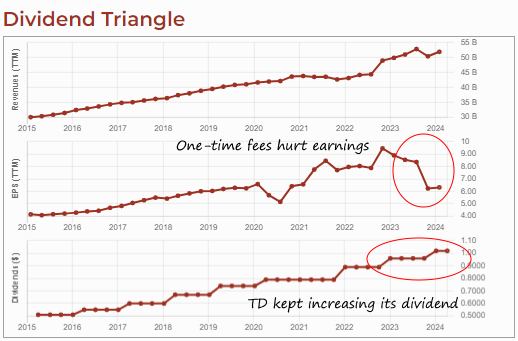
Yet TD kept increasing its dividend last year and will continue in 2024 why? While the one-time events hurt the business, going forward, we’ll forget all about those as the business will thrive.
What about dividend growth slowing down?
Slowing dividend growth is usually the result of the rest of the dividend triangle; it’s rare to see a company with a high single-digit to double-digit growth for revenue and earnings whose dividend growth is slowing down.
If you see a dividend increase slowing to 3% and then 1% after being at 6% over 3-4 years, chances are both revenue and earnings were slowing down before that. It is prudent management to slow dividend growth rather than bleeding a balance sheet to death just to pay shareholders, but it’s also a red flag.
Find stocks with a strong dividend triangle from our Rock Stars list, updated monthly!
Can the payout ratio help to assess dividend growth health?
Yes, definitely. When the dividend triangle is weakening and the dividend growth is slowing down, the payout ratio is probably rising. Now we’re looking at the Sell button on our dashboard. However, it’s important to look at the appropriate payout ratio. There’s the classic payout ratio based on earnings. As I said earlier, earnings are based on accounting principles, not on cash flow. You should be mindful of that.
The cash payout ratio is an interesting metric. It’s based on free cash flow, so it does not consider the company taking on more debt to finance capital expenditures. For a capital-intensive business, the cash payout ratio is not perfect either. Instead, use the funds from operation FFO payout ratio. You could also simply compare the company’s dividend per share with the amount of Distributable Cash Flow (DCF) per share to see if there is room there for future dividend growth. See The Different Payout Ratios – A Quick Tour for more details about them.
Again, context is essential. That said, a weak dividend triangle and a payout ratio getting higher starts to scare me a bit more and bring me closer to selling, but I’ll do more research.
What other metrics can help understand a weak triangle?
When I’ve established that I’m concerned about a stock’s triangle, I start by looking at the cash from operations metric, because cash is closely linked to the ability to pay a dividend.
I also look at the long-term debt trend. If the debt keeps rising, and the payout ratio is above 100%, the company is leveraging its future; it better succeed in bringing profit and cash flow to the table and later because if not, it’s literally financing its dividend.
Growing debt can be understandable when there are large projects to fuel growth; the company is financing its projects and using its cash from operations to pay dividends. However, this situation cannot be sustained for a long time. It can last for a few years, but at some point, the company must stop adding debt and pay some of it down.
What’s next?
If after looking at these two sets of metrics (the three dividend triangle metrics, and the payout ratio and debt), I feel it might be fine to keep the stock, I do more qualitative research. The goal is to understand more about what’s wrong with the business model. Is it the economy hurting the business? Competitors? Can management resolve the problem? Has management said it was addressing the problem during the earnings conference call? If they just ignore the problem, that’s another source of concern.
For how many quarters should we tolerate a downtrend?
It’s not so much about a set number of quarters, but rather the reason why the metrics are slowing down. If it’s due to an economic cycle, like a recession that causes many companies in the consumer discretionary to have even two years of bad results or poor growth. Knowing that it’s normal in a recession, I would not sell after one year. However, if it’s because the business is losing market share and not finding ways to improve over several quarters, then it would be getting close to my sell list.
 To mitigate the risk of utilities having too much power, some countries, provinces, or states nationalized these resources to provide them at a lower price. Often, in Canada and the U.S., governments allow private companies to manage and distribute electricity, gas, and water. Granting such power to private entities couldn’t be done without strict rules. Hence, utilities usually operate in a highly regulated environment. Governments decide the price of power and water that is charged to customers.
 Most often, those projects are financed by issuing additional shares of stock or taking on more long-term debt. When interest rates rise, the cost of new financing increases, reducing the projected profitability of the project. In short, there will be less cash left to increase the dividend.
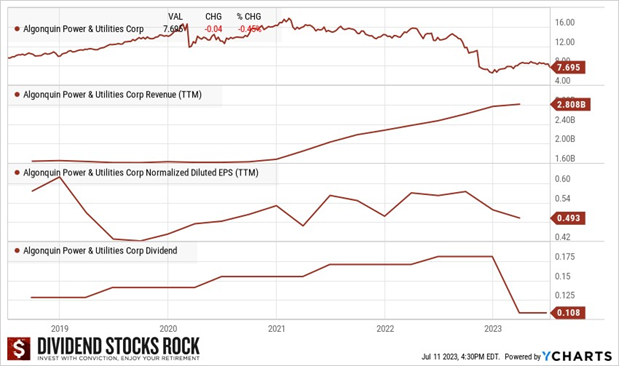
 When we describe consumer staples, we often say they are all the products you can find in your house. Products you must buy no matter what happens in your life. Companies in this sector have built stellar brand portfolios that support repeat purchases from their customers. Repetitive purchases lead to constant and predictable cash flows. Therefore, food, beverage, and household products are a great foundation for building a dividend growth portfolio.
 Since consumers rely on many of these products, they’ll likely cut their expenses for consumer discretionary products, such as restaurant meals, non-essential clothing, travel, and entertainment, to prioritize consumer staples products. Keep in mind that while stocks in this sector offers great protection when the market goes sideways, you must have them before market sentiment shifts downward to benefit from their protection. When the market panics, consumer staples usually trade at higher valuations, i.e., their PE ratios increase.
 It’s hard to identify a good time to buy consumer staples stocks because they’re rarely “on sale”. When everybody is making money in the market and growth stocks get most of the love, you have a shot at buying lesser-loved consumer staples. This is the type of investment that you almost regret having made during a bullish year because they often lag, showing minimal growth during boom times. On the other hand, when panic spreads, these companies hold the fort and ensure your portfolio doesn’t go bust.
 Dividend reinvestment plans (DRIPs) are an investment tool that allows shareholders to reinvest cash dividends received from a company’s stock into more
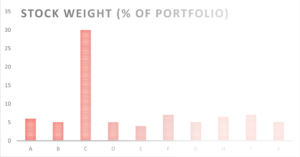 Participating in a DRIP increases investors’ positions in some stocks automatically without them having to lift a finger. Over time, you could end up with overweight positions for these stocks if you don’t monitor your portfolio.
 Canadian stocks paying USD dividends or trading on an U.S. market (either the NYSE or NASDAQ), or both. Why? Canadian dividend stocks are fascinating. Many of them operate in small niches and pay handsome dividends.
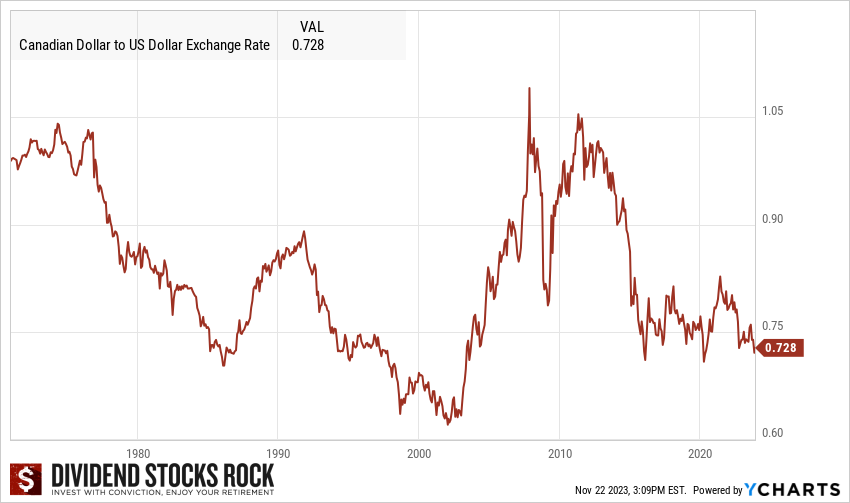
 (BCE, TU, RCI, ): Like Canadian banks, telecoms operate in a small oligopoly where 90% of the wireless market is controlled by BCE, TU and RCI. BCE and TU are long-time dividend growers.
  (TFII, CNI, CP,
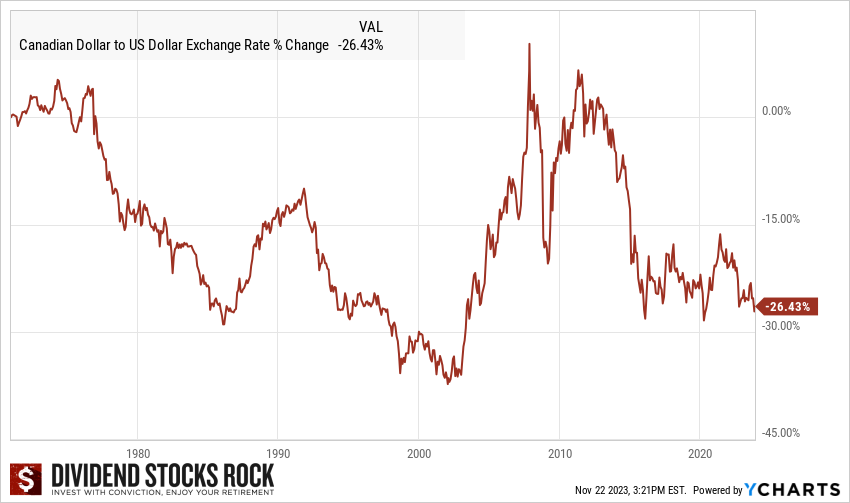
  In general, the advantage of Canadian stocks paying a USD dividend is more for the company, because it generates most of its revenues in USD as explained earlier. For investors, it could be a source of headaches or frustrations (you don’t want your broker making a sweet 2% conversion rate fee on your dividend, right?). However, if you plan a vacation or retirement in the U.S., having Canadian stocks paying their dividend in Uncle Sam’s dollar is a natural hedge against currency fluctuation. You can build a part of your portfolio with those Canadian stocks along with other US stocks and you’ll be set to never have to worry about converting your money “at a bad rate” in the future.