• Skip to main content

MOOSE MARKETS

INVESTING THE CANADIAN WAY

  • Dividend Investing
    • Best Canadian Stocks to Buy in 2025
    • Dogs of the TSX – Beat The TSX! 2025
    • Canoe Income Fund
    • Canadian Banks Ranking 2025
    • Canadian Dividend Rock Stars List
    • Canadian Dividend Aristocrats 2025
    • Buy and Hold Forever Stocks
  • REITs
    • Canadian REITs Beginner’s Guide
    • Best Monthly REITs 2025
  • How To
    • Income Products at Retirement
    • 4 Budgets of Retirement
    • Create a Cash Wedge at Retirement
    • 5 Questions for a Confident Retirement
  • ETFs
    • Guide to ETF Investing
  • Portfolio Strategies
    • Canadian Depositary Receipts (CDRs)
    • Building an Income Portfolio – Made Easy
  • Newsletter
  • Podcast

Portfolio Strategies

Common Investing Mistakes: Waiting for Market Pullback & More

Among common investing mistakes is waiting for market pullback hoping to buy stocks at a cheap price. Another is holding on to loser stocks hoping their price goes back up. These mistakes put your retirement at risk and keep you from sleeping well at night. Learn what you can do about it.

Learn about the other three frequent mistakes investors make here.

Download our Recession-Proof Portfolio Workbook to learn more about building a resilient portfolio.

Waiting for a Pullback

Buy low, sell high, basic and sound investing advice for anyone starting their investing journey. So, what do you do when the stock market keeps climbing higher? You’re not going to buy high, are you? When the market’s trading close to an all-time high, it’s very tempting to wait for the next crash before investing

Why you do this

History is full of investing horror stories. Over the last 25 years alone, we’ve seen the tech bubble, the Twin Towers terrorist attack, the 2008 financial crisis, the oil bust in 2015, the 2018 quick bear market, and the 2020 pandemic crash. Inexplicably, many investors think of the events of went up 145% while the U.S. market tripled!
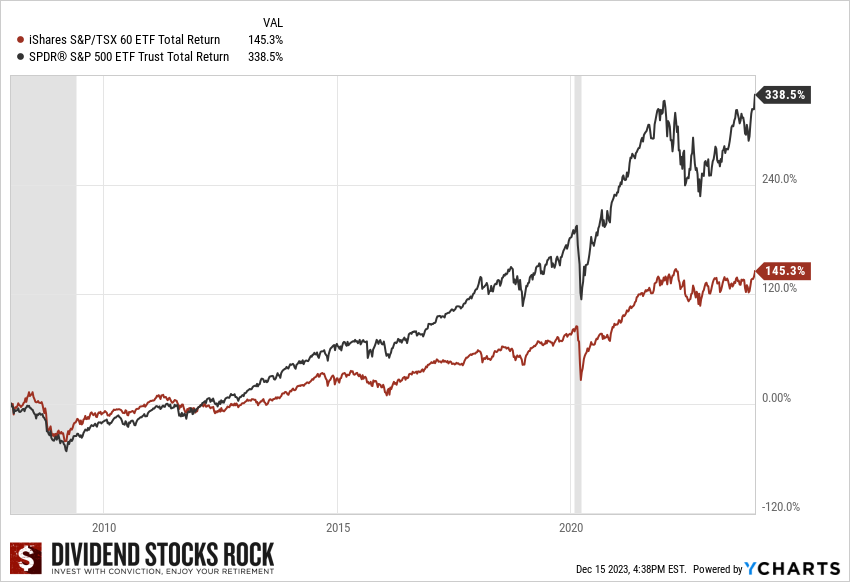
Graph of total returns for ETFs of TSX 60 and S&P 500 from 2008 to 2023

Hoarding cash until the next crash seemingly makes sense; you’ll buy shares at an incredibly low price and enjoy strong returns when they go back up. Why buy now if you can get it cheaper later? And, while you wait, you won’t lose any money on the chunk you hold in cash. A win-win situation; earn interest on your cash now and bargains in the market later. Wrong!

How it hurts your portfolio

It’s true that investors who invested in 2009 show impressive results today. If the events of 2009 occurred every 5 or even every 10 years, waiting for a major pullback would be a defendable strategy. The opportunity to invest after a major stock market correction is quite rare. Since 1970, there have only been three pullbacks that would’ve been worth the wait (1973-74, 2000-01-02 and 2008-09).
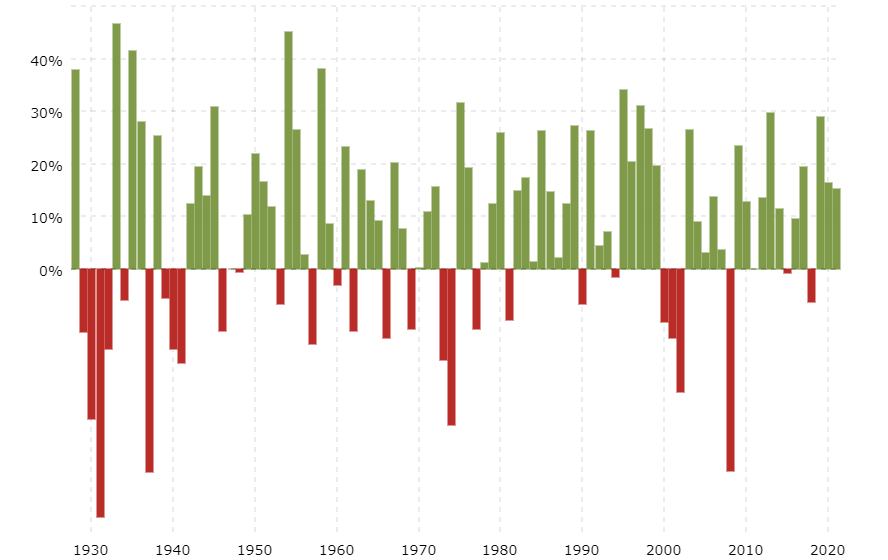
Bar chart showing yearly market variation since the 1928. Only three major market crashes since 1970.
A long wait – Only three major market crashes since 1970

Most often, you’d wait nine years for the next major crash. Who can afford to wait a decade to invest? An insidious effect of waiting is that it makes you doubt your investing plan. Case in point: on December 26th, 2018, both markets had just decreased double-digit from their peak levels. Did you invest all your available money then? This was a major pullback. You probably didn’t invest more money in December 2018 because you were thinking about the possibility of another 2008 or 2000-2002. None of us knew it was the start of yet another bullish segment. Nobody waives a flag to tell us it’s time to buy.

Fixing it

In 2013-2014, most financial analysts and the media said the market was overvalued, be it Forbes, Goldman Sachs, or Motley fool. Everybody agreed the market was way overvalued again in 2017, and again in 2022.

Stock Buying Process: child following instructions to assemble Legos
Build according to plan

In 2017, I didn’t care where the market was from a valuation standpoint. Selecting from the finest dividend growers at that time, I built my portfolio. Even if a pullback happened 3 months after I invested, I knew my dividend payments would continue to increase during the correction. Sooner or later, share values would go back up… because this is what happens, repeatedly.

Despite 2018, a terrible year, I was better off fully invested during that time than if I had kept 30% to 50% of my portfolio in cash to invest on boxing day. The capital appreciation from early fall 2017 to summer of 2018 combined with the dividends paid exceeded temporary losses incurred during the rest of 2018. None of the calculations I made showed that waiting would have been better.

So, when you think you shouldn’t invest money, focus on your dividend growth plan instead of the stock value. To add in some protection, you can plan to invest at intervals over a 6- to 9- month period. See How to invest a lump sum.

Investing with confidence prevents waiting for a pullback. Our DSR portfolio returns show that even during the market correction of 2018, the focus on dividend growing stocks minimized losses. The best protection against a market crash is a solid portfolio, holding robust dividend growth.

Download our Recession-Proof Portfolio Workbook to learn more about building a resilient portfolio.

Thinking it’ll Bounce Back

Many people invest in the wrong companies. Making poor investment decisions happens to all of us. My positions in Lassonde (LAS.A.TO) and Andrew Peller (ADW.A.TO) were in the red, about 30 months after I bought them. For a while, I waited, but eventually sold my shares of both as they didn’t fit my investment thesis.

Why you do this

Hourglass
How long do we wait?

None of us want to buy high and sell low. We’ll justify the first 10-20% loss as a temporary setback, the market doesn’t get it, or investors will realize it’s a good company. It’s hard to admit mistakes. It hurts our ego, and our brain does all it can to protect that ego. So, we patiently wait for our losers to come back on track and prove us right.

We also tell ourselves that selling at a loss is acting on fear, and we don’t let our emotions drive our transactions. It’s good reflex to have, but we must analyze our losers to decide to keep or sell them.

How it hurts your portfolio

Investors keep their losers because they focus on the money lost. After making a bad investment that’s trading 40% lower than what you paid, not much else can go wrong. How can you possibly lose more? So, you keep your shares thinking one day it’ll bounce back, and you could recover your money.

In doing so, you leave a lot on the table; there’s an opportunity cost when keeping your money invested in a bad place. What if you cut your losses and bought shares of a strong dividend grower instead? Worried you’ll make another mistake? It could happen, but since you already made one, you learned from it and will make better choices.

Some years ago, I held shares of Black Diamond Group (BDI.TO). The company faced challenges after the oil bust of 2014-2016 and cut its dividend. Sticking with my investing principles, I sold my shares right away and took the loss. I wasn’t happy to lose money and felt a bit dumb for having bought it in the first place. I was wrong with my investment thesis, and I wasn’t fast enough to see the dividend cut coming. Instead of whining about my bad investment, I moved on. With the proceeds, I bought shares of Canadian National Railway (CNR.TO / CNI). The rest is history:
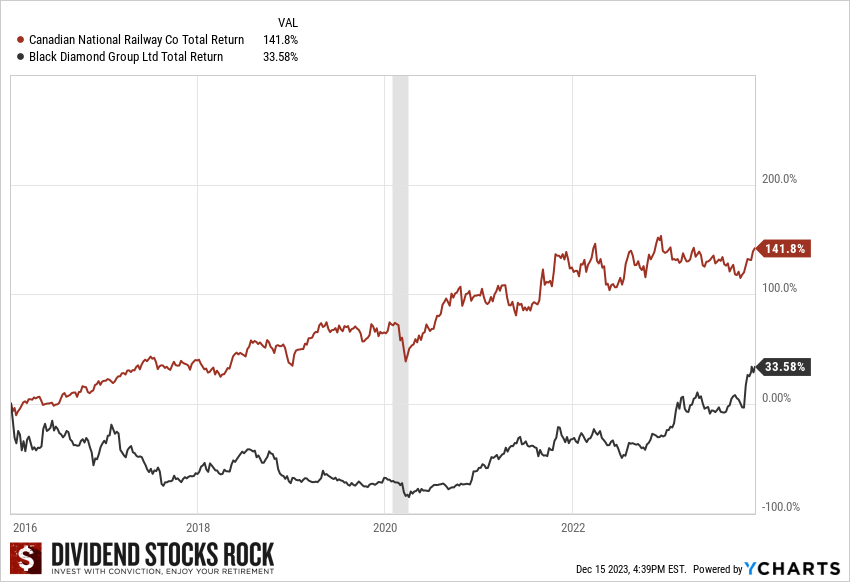
Graph showing CNR's total return from 2016 to 2023 far outpacing those from the Black Diamond Group

Had I waited for better days with Black Diamond, I’d have suffered a second dividend cut and lost even more money. Meanwhile, my new shares of CNR appreciated in value substantially and the dividend kept increasing.

Fixing it

Investigate why your loser stocks are losers; perhaps they suffered a one-time event or temporary setback? Or perhaps metrics over 5 years show more serious problems with the company, like lack of growth, absence of dividend increase, a dividend cut, ballooning debt, etc. To avoid future mistakes, find where you went wrong; were you blinded by the company narrative, seduced by a high yield, in denial about the risks the company faced? See 7 Reasons we end up With Loser Stocks, What to do About it.

Build a list of replacement stocks; those you’ve researched and would like to own. The best way to get over selling a loser at a loss is to get a shiny new thing!



What’s Happening with Renewables?

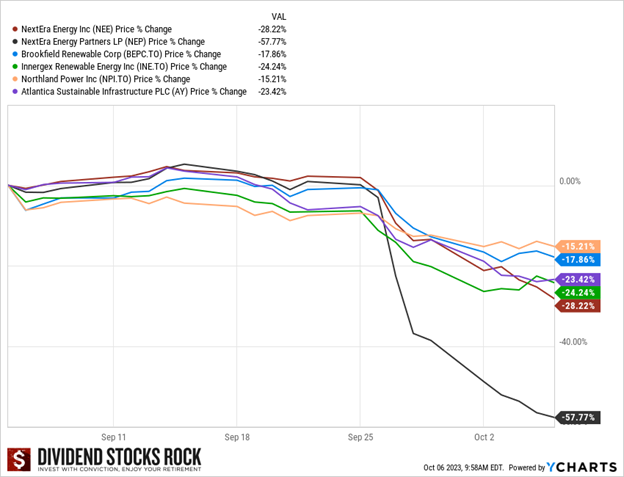
What’s happening with renewables? Renewable stock prices dropped spectacularly in the last few weeks, as shown here. If you have renewable energy stock in your portfolio, you might be in shock.

Graph showing stock price dropping for 6 renewable energy companies dropping from 15 to almost 58% since late September 2023

What caused that chaos?

It’s not a dividend cut or an absence of dividend growth. On September 27, NextEra Partners (NEP) lowered its guidance for the growth of its distribution per unit from 12%-15% per year down to 5%-8%, with a target growth rate of 6% per year. The CEO explained the reasons in this press release. NEP’s distribution rose 89.78% over the past 5 years with an annualized growth rate of 13.67%.

Earlier in May, NEP had announced a strategic shift by confirming its intention to sell its natural gas pipelines.

The goal of selling assets and lowering the dividend growth policy is to give NEP more financial flexibility and maintain its ability to invest in new projects to pursue growth. It’s also to pay off debts that are coming due.

NEP’s debt

Companies can use debt or issue more stocks/units to finance projects. Convertible Equity Financing Portfolio (CEFP) is a way to get financing where you pay the debt either in cash or in units when it comes to maturity.

NEP uses a mix including convertible equity financing; it gets money “today”, betting that its unit price goes up before the debt comes to maturity, thus getting a good deal by issuing units at a higher price to pay it off. NEP has roughly $1.5B of convertible equity financing debt to pay off through 2025. With the stock dropping nearly 60% recently, you can count on them not issuing additional units for near term financing.

This highlights how sensitive most renewable utilities are to rising interest rates. NEP is stuck between a rock and a hard place. Future debt will carry interest rates of 7%-8% while issuing units with such a depreciated stock price would only drive the price lower by diluting shareholders’ investments.

Want a portfolio that can withstand all this economic turmoil and provide you with enough income? Download our Dividend Income for Life Guide!


What’s next for NEP?

NEP is walking is on the edge, but that doesn’t mean it’ll fall. Numbers seem to work until 2025, assuming no further major interest rate hikes. However, it’s not out of the woods.

The pessimistic scenario has NEP facing higher interest rates while its unit price doesn’t bounce back. NEP would eventually face a possible dividend cut or see NextEra Energy (NEE) buy all its units. A leader in renewable energy with a market cap of $97B, NEE owns 51% of NEP, whose market cap is $2B. NEP shareholders wouldn’t be happy with this outcome because they wouldn’t get much for their units.

The optimistic scenario sees NEP on the edge for a few years, with interest rates decreasing before 2026, when more debt (including CEFP) comes to maturity. We’d see NEP’s unit price slowly but surely go up, the dividend paid, and growth back on the table. At this point, however, NEP would be a high-risk, high-reward investment.

What about other renewable utilities?

Now’s the time to make sure you have a solid portfolio. This implies digging deeper to ensure companies you hold show strong financial metrics. Unfortunately, utilities aren’t easy to analyze; they use both GAAP (generally accepted accounting principles) and non-GAAP (like homemade calculations), and often use Funds from operations (FFO) per unit, found in press releases and quarterly earnings reports.

Renewable energy: Solar panels seen from the ground, behind pink flowers Look for investors’ presentations and quarterly earnings reports on the company website. Doing that reveals that another renewable, Brookfield Renewable (BEPC/BEPC.TO), hosted its investors day in September. Contrary to NEP, BEPC reaffirmed its growth expectations and distribution growth targets…business as usual for BEPC.
Different companies, different business models, different debt structures. When a NEP-like situation happens, solid companies are also punished, unfairly, because the market puts them in the same basket as the one with the problem.

It’s clear that all utilities will suffer for a while. Higher interest charges hurt their balance sheet and cash flow, while simultaneously drawing retirees to bonds and GICs and away from utilities. In fairness, when 10-year government bonds offer over 4.5%, income-seeking investors would be fools to go for stocks paying the same yield.

How to look at renewable utilities

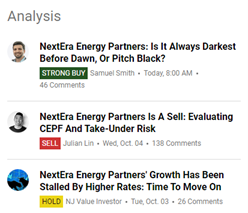
Renewable energy companies: Headlines of 3 articles on Seeking Alpha about NextEra showing very different opinions about how it should be ratedFirst, ignore the noise, or you’ll get lost in a myriad of conflicting information. Here are three articles on Seeking Alpha for October 6 (Strong Buy, Sell, and Hold ratings).

I read all three; each makes solid points. If I rely on their opinion, I have no clarity.

Best to develop your own opinion. How? Follow the same process as always: make sure your investment thesis (the narrative) is backed by the numbers.

1 – Start with the dividend triangle.

The EPS won’t be of much use for utilities; review the revenue and dividend growth trends.

Weak dividend growth, or none, raises a huge red flag. If you’re choosing between two stocks and one shows no or weak dividend growth, eliminate it as a candidate.

2 – Look at the FFO/unit (common replacement for EPS for utilities) on the company’s website.

3 – Look at the company’s debt structure and maturity in its investor presentation.

There’s a big difference between fixed-rate debt over a long period of time vs. floating rates or short-term maturities that will push interest expenses higher.

4 – Look at the company’s past track record to see how it performed in other difficult periods. You’ll have to go back to the 2008 crisis to see how they fared, but it’s time well spent if you’re unsure of some stocks.

Create yourself a large enough paycheck. To learn how…download our Dividend Income for Life Guide!


Renewables aren’t dead, just facing substantial headwinds

Renewables are facing stronger headwinds than classic utilities due to their business model. Many classic utilities—Fortis, Canadian Utilities, Xcel, and WEC Energy—operate regulated assets. They’re granted a monopoly over an area to ensure quality, stable service. In exchange for that monopoly, utilities cannot raise their rates as they see fit. They must present a case for increasing rates to the regulator, who assesses whether the increase makes sense for both the utility and its customers. When interest costs increase, regulated utilities have more pricing power because it’s easier to justify rate increases.

Renewables don’t enjoy a monopoly because their energy source is less stable and complements other sources. They can raise prices freely, but they face more competition. In the current economic environment, I bet they’d love to negotiate rate increases with a regulator!

Renewables and other capital-intensive businesses (Telcos, REITs, pipelines, etc.) will have a rough ride until we know that interest rate increases are over and that we’re heading toward reductions. We’re not there yet; you must decide if you want to “walk in the desert”. Again, focusing on dividend growers helps.


High-Income Products: Split-Shares and Covered-Call ETFs

Continuing last week’s article about whether high-income products rally make your life easier, we now look at two other types of high-income products: split-shares and covered-call ETFs.

Split-share corporations

Specialized investment corporations are created primarily to provide investors with a choice: a regular income stream or potential for capital appreciation. They do so by splitting their shares into two classes.

A split-share corporation is created by purchasing a diversified portfolio of common shares of other corporations, often blue-chip stocks. Then, the corporation issues shares:

  • path in forest splits in two, with fall foliagePreferred Shares: usually offer regular dividends, have a set redemption value, and take precedence over other shares if the company is dissolved.
  • Capital Shares (or Class A): are more volatile but provide potential capital appreciation. They receive the residual value after preferred shareholders are paid in full. They can show high returns if the portfolio appreciates, and large losses when the reverse happens.

Using the dividends of the underlying portfolio, split-share corporations pay the preferred shareholders first. They reinvest excess dividends into the portfolio or distribute them to capital shareholders.

Split-share corporations usually have a maturity date, when their sell their assets and pay the proceeds to shareholders. Again, preferred shareholders are paid first, up to their original investment plus accrued dividends. Remaining funds go to capital shareholders.

Create a long-lasting retirement income with our Dividend Income for Life Guide. Download it free!

Advantages and risks

Advantages of split share corporations include the choice between a more stable income or potential capital appreciation, tax advantages for some investors due to how they distribute the income, and potential for high income, as long as the company pays.

Unfortunately, they come with many risks. Not immune to market fluctuations, both preferred and capital shares can suffer if the portfolio’s stocks drop, with capital shares most vulnerable.

With an under-performing portfolio, many shareholders could redeem their shares, forcing the company to sell assets at an unfavorable time; capital shareholders might not recover their full investment upon the corporation’s maturity.

Split-share corporations often borrow to purchase assets, which amplifies both gains and losses based on asset performance vs. interest rates and heightens the volatility of capital shares. Poor-performing assets can also hinder loan repayment and affect the corporation’s credit rating.

Rising interest rates can devalue their portfolio just when fixed-income options become more attractive to investors.

Covered call 101

A call is an option granting the right to buy an asset at a set price within a specified period. Imagine DSR trading on the market with a stock price of $100. You buy an option to buy DSR stock at $105 in the next three months. If DSR stock surges to $120 during that time, you can buy the stock at $105, making an immediate profit. The owner of the shares who sells you the call option is writing a covered call.

Apple on top of pile of booksLet’s say DSR trades at $100 with a dividend of $1 quarterly, a 4% yield. You hold shares bought at $100 per share. You write a call option on those shares, granting the buyer the right to buy 100 shares at $110. The buyer of pays you $200 for the option.
If the stock price is stable or decreases, the buyer doesn’t exercise the option at $110, letting it expire. You keep your shares. You earned $200 from selling your option and another $100 in dividend (quarterly dividend of $1 X 100 shares). Selling the option generated additional income without any risk.

What if the stock price reaches $120? The buyer exercises the option; you must sell the shares at $110. You earn $200 from selling the option, $100 in dividend and $1,000 in profit (($110 – $100) X 100 shares), totaling $1,300.

Had you not sold the option, you’d show a paper profit of ($120 – $$100) X 100 shares = $2,000 of stock price appreciation, + $100 in dividend = $2,100. While you made money selling the option, you capped your total returns to the option price.

This is a popular strategy among income-seeking investors. So popular in fact, that there are several Covered Call ETFs offering juicy yields. But are they really worth the risk?

Create a long-lasting retirement income with our Dividend Income for Life Guide. Download it free!

Covered call ETFs

Writing covered calls can work well for individual investors, assuming they write judicious options; it’s a different story with manufactured covered call ETFs.

I suggest you watch this video about high yield covered call ETFs.

Let’s compare two ETFs, ZWB and ZEB, both manufactured by BMO, and both having a long history.

  • ZWB is a covered call ETF on Canadian banks.
  • ZEB is an equally weighted ETF on the big six Canadian banks.

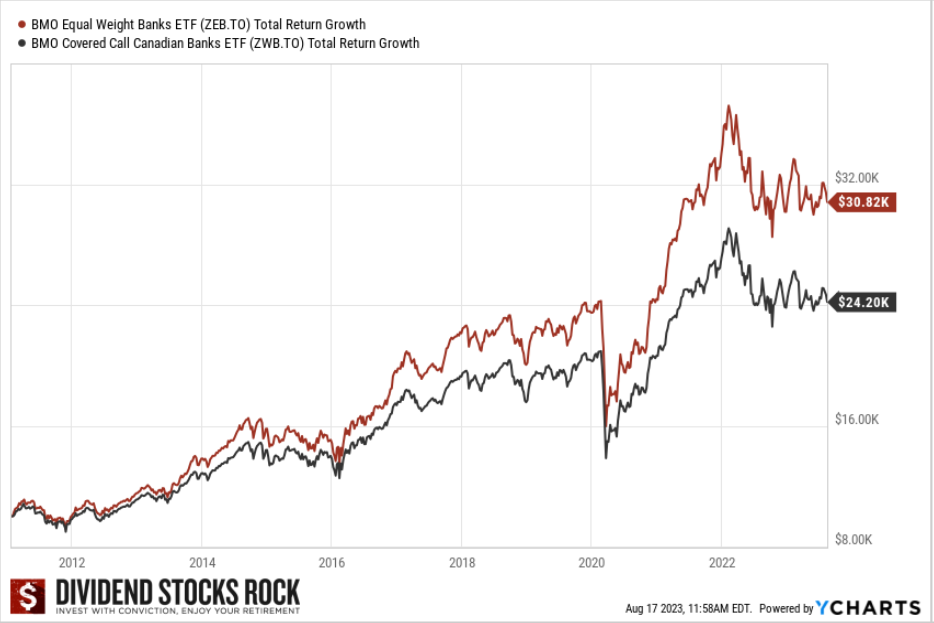
This graph shows how much money investors leave on the table with ZWB for the sake of higher income. Imagine investing $10K in each product and reinvesting all dividends…

Line graph showing total return growth for banking covered-call ETF is lower than equal-weight bank ETF.

As of 08/17/2023, ZWB offers a 7.18% yield and ZEB about 4.41%.

If you really want the 7.18% yield, cash ZEB’s dividends and sell 2.77% extra of your investment monthly to equal that yield. Over time, you’ll have a lot more money in your pocket. You can withdraw more than 7.18% yield or withdraw 7.18% for longer. In both cases, the pure investment strategy generates better results.

JPMorgan Equity Premium Income (JEPI)

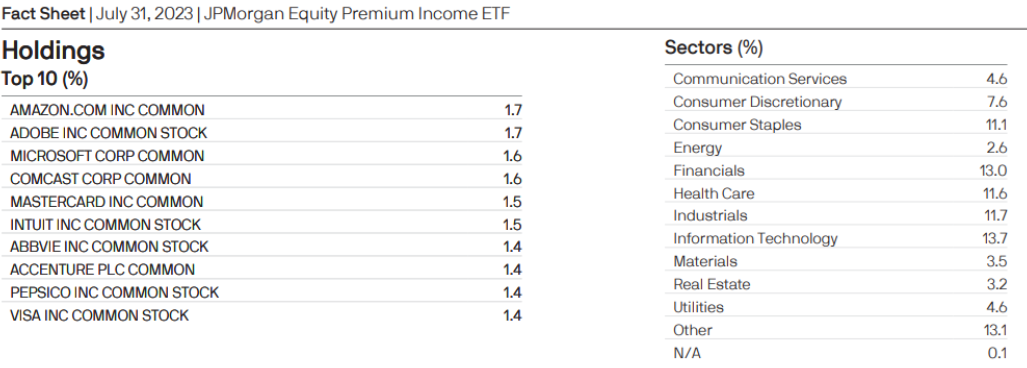
Incredibly popular on the US market is JEPI with its yield >6%. This ETF uses options to generate a high yield from a well-diversified portfolio of 137 holdings.

Top 10% holdings and sector allocation of JP Morgan's Equity Premium Income ETF as of July 31, 2023

Source: JPMorgan

Sadly, we’re limited to a short history. Nonetheless, when comparing JEPI to classic investment strategies, i.e., dividend growth investing or index investing, we see similar results as in our earlier example.

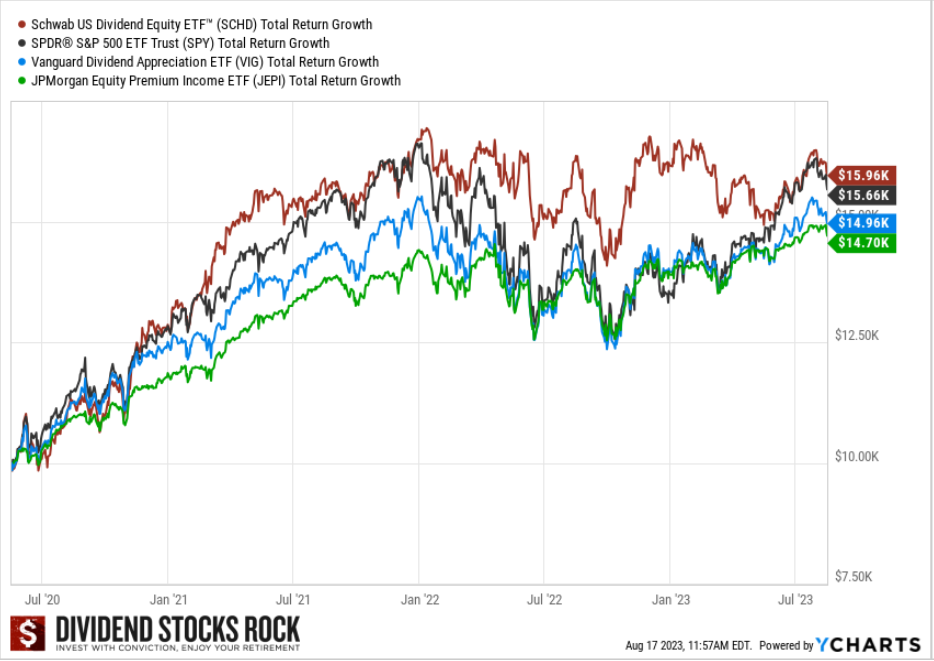
The next graph shows the total return of a $10,000 investment, reinvesting dividends, of JEPI and these three investment vehicles:

Investment vehicle Description
Schwab US Dividend Equity (SCHD) Dividend ETF focused on the Dow Jones U.S. Dividend 100 index
SPDR S&P 500 (SPY) Classic index fund tracking the S&P 500
Vanguard Dividend Appreciation ETF (VIG) Dividend growth ETF


Where’s the investment in JEPI after three years? At the bottom. As it was for the Canadian Bank ETF vs. Canadian Bank Covered Call ETFs, the income-focused product finishes dead last.

Line graph showing JP Morgan's JEPI ETF total return growth for 3 years lags behind three other ETFs that aren't covered-call ETFs

Conclusion

While covered call ETFs aren’t the worst products, they don’t provide added value compared to index or dividend growth investing. Focusing on high-income products often means leaving money on the table.

A classic investment strategy that generates a higher total return will serve you better. Then, you can sell a few shares and create your own retirement income.

High-Income Products: Making Life Easier?

Are high-income products really making life easier for retirees? Investing $100K in something giving back $800/month, a 9.6% yield, is appealing for retirees. Financial companies even say, “no need to worry about the unit price as long as you receive your payment”. If you get your monthly paycheck, why be concerned? Well, you should.

Child crossing stream on logFinancial companies, like asset managers, make fees based on the amount of Assets Under their Management (AUM). The higher the AUM, the higher the revenue and profit. Retirees are very profitable customers for these companies because of their sizeable savings, often in the hundred of thousands, that make growing AUM a lot easier than millennials investing much less. What do retirees want? Income!

When stock dividend yields are low, and interest rates on certificates of deposit, GICs, and bonds are low, how are financial companies able to generate additional income from their products? Often, with options and leverage strategies.

Using derivatives, they write covered call options and cash covered put options, or purchase call options. You put your cash in a black box, the firm shakes it a bit and pays you back. Often these strategies are fraught with risks. Consider the following points when contemplating these products.

Learn strategies for generating income for life. Download our guide now.

Understanding the strategy

Read the fine print to understand the strategy, Picture of a Magnifying glassFinancial companies often use a mix of options strategies to create income; you must understand what you’re investing in. You’ll have to read pages of boring stuff, and don’t stop at the description either!
From Financial Split (FTN.TO)’s description: “…is a high-quality portfolio consisting of 15 financial companies made up of Canadian and U.S. issuers”. With a 13.5% yield, it sounds promising. Further, you find this in their 2022 annual information form:

“Up to 15% of the net asset value of the Company may be invested in equity securities of issuers other than the Portfolio Companies.”

And: “To supplement the dividends earned on the Portfolio and to reduce risk, the Company will from time to time write covered call options in respect of all or part of the Portfolio.”

It goes on to mention writing cash covered put options or purchasing call options, purchasing put options to protect itself from declines in the market, trading to close out positions, using derivatives for hedging purposes, etc.

In English: on top of what’s in the portfolio, there could be 15% of “mystery” equities. It’s up to option strategists to work their magic to generate astronomical income.

How did FTN.TO work out for investors? Well, the monthly distribution remains unchanged since 2008. Oh, it skipped 34 monthly payments between September 2008 and December 2020, including 18 consecutive months starting in 2012 (source). So, not well at all.

These complex options strategies might work, or not. They do well when the market is moving up, not so much when things get volatile. From what I’ve observed, I feel that these aren’t products to expose your hard-earned savings to at all.

Learn strategies for generating income for life. Download our guide now.

Leaving money on the table?

I understand wanting income in retirement, but don’t neglect total returns; if you do, you might leave a lot of money on the table. Imagine investing in a new High Income DSR fund requiring a minimum 100K investment and starting with 9% yield.

Over time, you notice that while you’re getting your 9% yield, your 100K isn’t keeping up in value. Total return (capital gain + dividend) is still positive, but you didn’t make the money you would have with a classic index ETF. How would you react?

In my opinion, the value of your portfolio is just as important as the money you receive monthly. Compare the total return of high-income products with a benchmark (index fund, dividend ETF) to see how they measure up to the total return you’d get from more traditional investments.

Comparing apples to apples

To judge high-income products correctly, you must compare them to appropriate benchmarks. The returns for Canoe EIT income fund (EIT.UN.TO) show that, over 10 years. it beat the TSX consistently.

Table showing Canoe Income Fund returns versus those of the S&P/TSX Composite Index over 1 month to 10 years and since inception. It shows Canoe outperforming the index throughout.

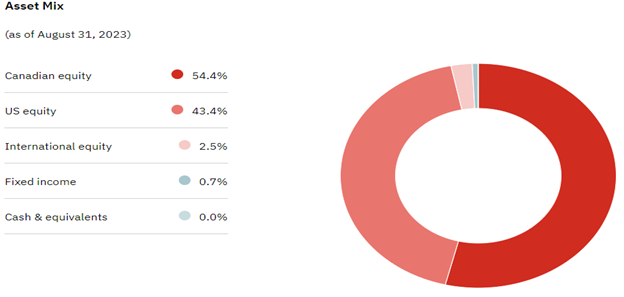
Beating its benchmark and a yield >9%? Perfect for retirees. Or is it? The EIT fund profile, shows 43.4% is invested in U.S. equities.

Pie chart showing the Canoe Income Fund's asset mix: 54.4% Canadian equity, 43.4% US equity, 2.5% International equity, and 0.7% in fixed income.

Therefore, the correct benchmark is a mix of Canadian, US, and international indices, not the TSX index.

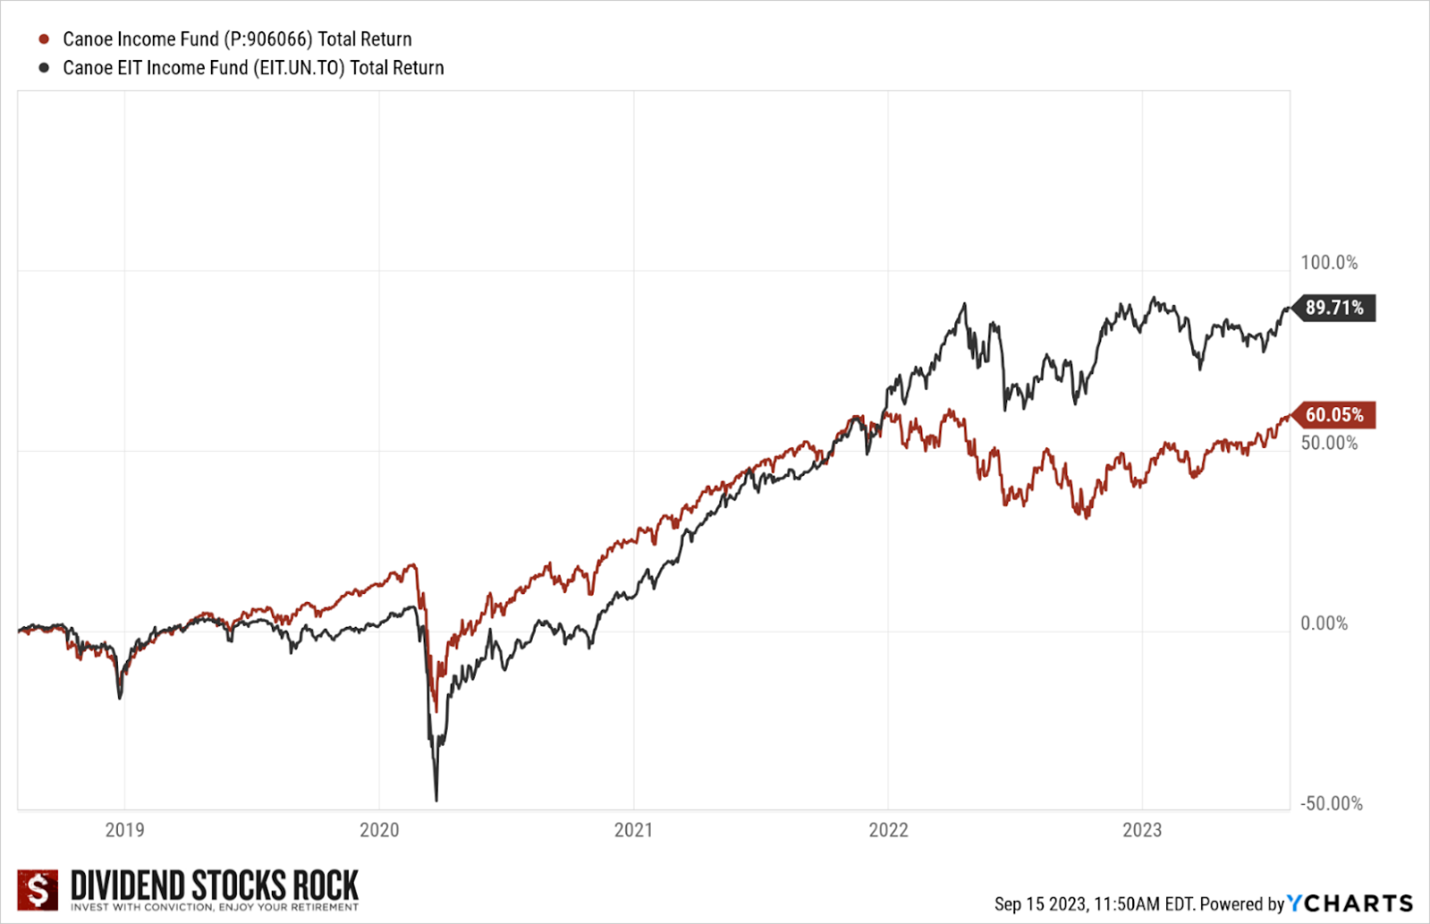
To compare apples to apples, I used a portfolio containing a mix of index ETFs that mirrors EIT’s asset mix: 54.4% XIU.TO for Canadian equity, 43.4% SPY for US equity, and 2.5% XEF.TO for international equity. The red line shows this index ETF portfolio’s total returns, including dividends, as of 7/31/2023.

Line graph showing total returns for Canoe Income Fund and custom index-EFT mix that is a more appropriate benchmark than the TSE index.

The index ETF portfolio 5-year return of 60.19%, or 9.88% annualized, is much lower than EIT.UN.TO at 13.5% annualized. However, Canoe didn’t consistently exceed the index ETF portfolio over 10 years; actually, EIT.UN.TO returns were equal to or below indices until 2021 when it surged ahead.

This is thanks to the management team’s superb job in positioning the fund portfolio to surf the energy boom in 2020. In 2022, the energy sector was one of very few sectors in positive territory, the S&P 500 closely resembled a bear market, and Canoe beat relevant indices.

While Canoe doesn’t use the correct benchmark to show its merit, the fund does generate strong results. However, between 2013 and 2019, it was barely better than the TSX. A single move, going massively into oil & gas, made a huge difference.

Learn strategies for generating income for life. Download our guide now.

In closing

Not all high-income products are terrible. In fact, Canoe has a pretty good overall performance. Comparing it to Financial 15 Split Corp (FTN.TO), with its complex strategy and poor results, clearly shows how the management team can make a huge difference.

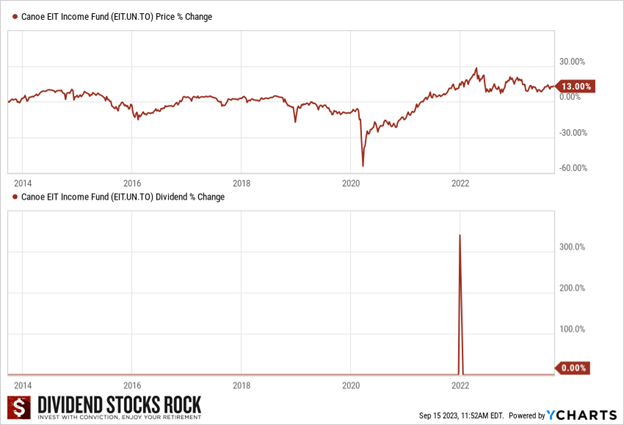
The Canoe fund could be interesting to generate a high income but, looking at the graphs below, keep this in mind: 1) your capital likely won’t grow over time and 2) neither will your dividend.

Line graph showing Canoe Income Fund unit price change and dividend change for 10 years up to 2023. Reveals not appreciating in value and dividend payment is flat.
Where’s the growth?

You’re still better off with a classic investment strategy that generates a higher total return. You can sell a few shares to create your own retirement income. See Generate Enough Retirement Income from Your Portfolio.

Next week, more on high-income products: split-share corporations and covered call ETFs. Stay tuned…

Retirement Cash Reserve: Surf the Market’s Waves

Having a cash reserve on-hand makes it easier to transition from your investment accumulation years to your retirement years and protects your portfolio during times of volatility.

Upright polar bear with one paw up, as if wavingThroughout your retirement, you’ll go through bull and bear markets. During a bear market, selling shares to generate your homemade dividend could hurt your retirement plan.
That’s when the cash reserve helps; it’s money that is not invested in the stock market anymore. It must be secure and easily accessible.

How to use the cash reserve

Your cash reserve bridges the gap between what your portfolio generates in dividends and your retirement budget; it prevents having to sell shares when it is not advantageous to do so.

If you need $50,000 per year and your portfolio generates $40,000, the gap is $10,000 per year.

The $10,000 gap could be filled by selling shares. Selling shares at a depreciated value could hurt your retirement, whereas dipping into a cash reserve keeps your portfolio intact. When the market recovers, you can sell additional shares to refill your cash reserve.

How much cash reserve is enough?

There’s no clear answer to this question. You want to mitigate the impact of market volatility on your withdrawal sequence, but you also want to maximize your portfolio returns.

A large cash reserve increases the short-term protection of your withdrawals but amputates your portfolio’s ability to generate higher returns on the market over the long haul.

Therefore, the amount of the cash reserve depends on the gap to fill and your tolerance to volatility. Some investors are comfortable without any cash reserve; they simply accept that they will sell shares yearly to complete their retirement budget, regardless of how the market is doing.

Others prefer a large cash reserve to cover all potential catastrophes. While most bear markets take around 24 months to recover, some have taken more than four years to fully recover.

Get some great stock ideas to build your portfolio and cash reserve with our Rock Stars List 

DOWNLOAD THE LIST HERE

Create a cash reserve

To create a cash reserve, you can stop reinvesting your dividends a few years before retiring and let the cash build up in your account. It’s on autopilot, simple, but it could take a few years to reach the required amount; during that time, the cash doesn’t generate any meaningful returns.

To let your portfolio work at full speed until the very last moment, you could sell one- or two-years’ worth of your financial needs in shares on day 1 of your retirement. However, if you retire at the bottom of the market, you’d be selling at a very bad time.

Cash reserve example

Imagine you have a $1M portfolio, an average dividend yield of 3.5%, and a retirement budget of $50,000/year. Since the portfolio generates $35,000 in dividends ($1M X 3.5%), the gap between what you generate and what you need is $15,000.

To ensure you don’t have to sell shares during a bad year, you decide to create a cash reserve of four years’ worth of the $15,000 gap, so $60,000.

Create and manage the cash reserve

In this example, a few years before start of your retirement, you stop reinvesting your dividends to let them accumulate. A year before your retirement date, you have your $60,000 cash reserve on hand.

You manage your cash reserve through a three-year ladder of Guaranteed Investment Certificates (GICs), Certificates of Deposit (CD), and/or bonds that would look something like this:

  • Three piles of golden coins, from small to large$20,000 for 1 year at 3%
  • $20,000 for 2 years at 3.25%
  • $20,000 for 3 years at 3.30%

You also keep accumulating your dividends in cash rather than reinvesting them.

At the end of the year, you retire

As you retire, your 1-year GIC/CD is worth $20,000 + $600 (one year of interest). Since you stopped reinvesting your dividends 12 months ago, you’ve also accumulated $35,000 in dividends ($1M X 3.5%).

Income on hand for year 1 of retirement

GIC/CD with interest $20,600
Dividends + $35,000
Total $55,600
Budget ($50,000)
Difference  + $5,600

You reinvest that extra $5,600 for another 3 years to feed the ladder and keep it going.

If it’s a good year and your portfolio is up, you sell shares to have just enough money to “refill” your bond ladder. Then you have another $20K to invest for 3 years. With the extra $5,600 on hand, you only have to sell $14,400 of shares to reach $20K and complete the ladder.

Notice that $14.4K on $1M equals a 1.44% capital gain. On most years, you’ll be able to do that easily without chipping away at your capital.

What if the market is bad?

If it’s not a good year and your portfolio is down, you can easily wait 6 months or a year and see where the market is at that time before selling shares. Really?  Yes, because you already have your income for the year and, at the end of year 1, you’ll have this on hand for year 2 of retirement:

2-year GIC/CD with 3.25% interest $21,321
One year of dividends* + $35,000
Total $56,321
Budget ($50,000)
Difference  + $6,321

* This is the same amount as the previous year; by investing in dividend growers, it is likely that some of your holdings increased their dividends, so this could be higher.

If at the end of year 2 of retirement the market is still bad, you still have your 3-year GIC/CD worth $22,046, and another 12 months of dividends from your portfolio.

Of course, waiting to sell shares during a bad spell in the market means that eventually you’ll have to sell more to refill your cash reserve ladder.

Retired couple walking toward the sea in Eastbourne on sunny day

Considering that most crashes happen over a few months or a year, after which the market starts recovering, and that the cash reserve ladder ensures you have over two years of buffer, you’ll be in a good position to refill the ladder using only or mostly your capital gains and dividend increases, thus securing your retirement for year to come!

Never Again! How to Avoid Loser Stocks in your Portfolio

I’m sorry to say there is no foolproof method to avoid loser stocks in your portfolio. It’s impossible to not make occasional mistakes as investors. If you can’t bear the thought of losing 30%, 40%, 50% of your investment in a stock, you should probably not invest in equities.

However, you can minimize the risks. In fact, you can reduce the number of times it happens, and you can also reduce the impact of those rotten apples in your portfolio. This starts by acknowledging our mistakes.

Recognizing our mistakes

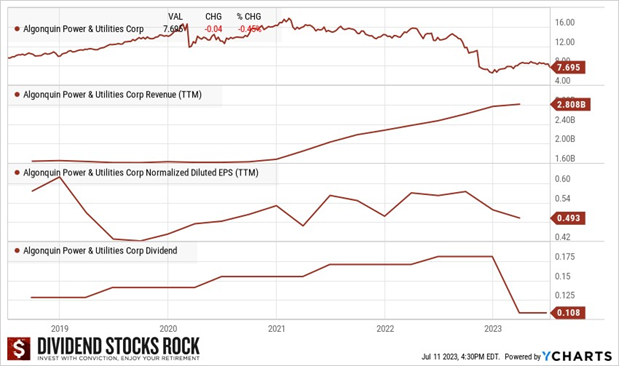
I’ve made mistakes in my investment journey. For example, with Algonquin (AQN):

  • I let the company narrative take too much importance in my analysis and ignored the financial numbers. Who doesn’t like a good story, right? Always rely on company fundamentals and metrics; they either back the narrative or reveal it as fiction.
  • Wearing pinked-colored glasses, I hoped for the best outcome and minimized the impact of the worst-case scenario.
  • I put too much faith in company management, thinking it would keep paying the dividend. Obviously, the dividend wasn’t a priority for AQN’s management team.

Algonquin's decline depicted with graphs of its share price, revenue, EPS and dividend from 2018 to 2023.

Other common investing mistakes are:

  • Being seduced by a high yield: investors often concentrate too much on the generous dividend yield in their decision to buy or keep a stock. Appealing as a high yield might be, it is often a warning sign.
  • Underestimating the potential downside of a company. No company is invincible. Being aware of the risks is a good defense; knowing about a company’s dependency on the housing market will alert you to watch its results when interest rates rise. Just as risk awareness helps to spot a problem stock, it can also prevent bad buying decisions.

Another mistake that adds to the pain of having a loser stock is investing heavily in a single stock, thus granting it too much weight in your portfolio, without considering the effect a dropping stock price will have on your portfolio.

An ounce of prevention: portfolio review to detect loser stocks

Always review of all your holdings quarterly so that you can detect when you have overweight sectors or stocks, verify that growth is still in the cards by consulting the dividend triangle, identify red flags, and investigate them properly.

During your quarterly review:

  1. Identify your core holdings, educated guesses, and falling knives
  2. Make sure your core holdings represent most of your portfolio; rebalance if needed.
  3. If you see a dividend yield above 5%, consider it a red flag and investigate that stock further; does it still fit your investment thesis? Does the company have growth vectors? Are the revenue and EPS growing consistently? Is the dividend growing, has its growth slowed down?
  4. Be more demanding about the stocks you keep, for example, look for stronger dividend triangle, a low payout ratio, companies meeting expectations and not lowering their outlook.
  5. Do not hesitate to sell a loser stock, even if it hurts.
  6. Resist the appeal of exciting, sexy, growth stories. Go for boring, yet consistent and recession-resilient investment narratives.

Have a replacement list ready

When a $10,000 investment is now worth $6,500, I try to get the $10K figure out of my head and focus on how I can most efficiently invest what is left.

Make a list of stocks you’d like to have but don’t have money to invest in yet. Choose companies that have good growth potential and a strong dividend triangle in different sectors. Not sure where to start? Download our Dividend Rock Stars list!

DOWNLOAD THE LIST HERE

Comparing two stocks

Equipped with my replacement list, I look for a decent replacement in the same industry as the loser stock I’m considering selling. Then, I compare both stocks, analyzing six factors:

  1. The business models

Review the business models to understand how each company can make money and to find similarities and differences between them.

  1. The dividend triangle

The dividend triangle is an overview of a company’s metrics and the trend of its revenue, EPS, and dividends. Two companies in similar environments would have similar growth metrics.

  1. Dividend safety & growth potential

How of the dividend going to evolve? Double-digit or mid-single digit growth? Low growth, no growth, or cut? Dividend safety and growth potential is assessed by analysing the dividend triangle, the company’s payout ratios, and potential risks.

  1. Growth vectors

Growth vectors point to how a company should grow in the coming years. Reviewing a company’s business model and studying revenue and earnings trends can give you a good idea. Two companies in the same industry can show similar growth vectors.

  1. Potential risks

Review the risks the companies face; are they particularly vulnerable to interest rates, commodity prices, increased regulation? Do they carry a high debt load? Are they in an expanding market? Companies in the same industries might face similar risks.

  1. Valuation

To compare two companies, assess the value of each one’s stock value. Valuation methods include the P/E ratio trend over several years and the Dividend Discount Model (DDM).

Dividend Stocks Rock (DSR) members can find all of the information needed on the stock cards and compare two of them side-by-side. Other sources of information are the investor relations section of each company’s website, and stock reports by third-party financial analysts.

  • « Go to Previous Page
  • Page 1
  • Page 2
  • Page 3
  • Page 4
  • Go to Next Page »

Copyright © 2025 · Moose Markets