• Skip to main content

MOOSE MARKETS

INVESTING THE CANADIAN WAY

  • Dividend Investing
    • Best Canadian Stocks to Buy in 2025
    • Dogs of the TSX – Beat The TSX! 2025
    • Canoe Income Fund
    • Canadian Banks Ranking 2025
    • Canadian Dividend Rock Stars List
    • Canadian Dividend Aristocrats 2025
    • Buy and Hold Forever Stocks
  • REITs
    • Canadian REITs Beginner’s Guide
    • Best Monthly REITs 2025
  • How To
    • Income Products at Retirement
    • 4 Budgets of Retirement
    • Create a Cash Wedge at Retirement
    • 5 Questions for a Confident Retirement
  • ETFs
    • Guide to ETF Investing
  • Portfolio Strategies
    • Canadian Depositary Receipts (CDRs)
    • Building an Income Portfolio – Made Easy
  • Newsletter
  • Podcast

REITs

Canadian REITs Beginner’s Guide

Want exposure to real estate without the hassle of fixing leaky faucets or chasing tenants for rent? That’s where Canadian REITs come in. These high-yield investments offer steady income, inflation protection, and real estate exposure — minus the landlord stress.

Thanks to their unique tax structure, REITs are designed to return most of their income to shareholders, making them ideal for income-seeking investors.

What Are REITs & Why They Matter?

REITs are not only popular because they distribute generous dividends, but also because they’re easy to understand. Investors can picture an apartment building or an office tower and tenants paying their rent monthly. Investors are willing to purchase units of those businesses in exchange for the income and peace of mind.

The concept of being a landlord and having tenants is comparatively simple to understand. The company owns and manages real estate and receives rental income from properties such as apartment complexes, hospitals, office buildings, timber land, warehouses, hotels, and shopping malls.

Most REITs are equity REITs. They must invest most of their assets (75%) into real estate (properties) or cash equivalents. In other words, they cannot produce goods or provide services with their assets. They must generate 75% of their income from those real estate assets in the form of rent, interest on mortgages, or sales of properties.

REITs must also pay a minimum of 90% of their taxable income as dividends to shareholders each year. Therefore, the classic earnings per share (EPS) and dividend payout ratios don’t gauge an REIT’s health.

3 Types of REITs: Equity, Mortgage, and Hybrid

Equity REITs

Equity REITs own and invest in property. They may own a diversified set of properties, and they generate income primarily in rent payments from leasing their properties.

Mortgage REITs

Mortgage REITs, or mREITs for short, finance property. They generate income from interest on loans they make to finance property.

Hybrid REITs

Hybrid REITs do a bit of both, as they own property and finance property.

In general, REITs offer great investment opportunities by their nature. A growing economy leads to growing needs for properties. REITs can grow organically as the population requires more industrial facilities, healthcare centers, offices, and apartments.

Sub-Sector (Industry)

REIT – Diversified REIT – Mortgage REIT – Specialty
REIT – Healthcare Facilities REIT – Office Real Estate – Development
REIT – Hotel & Motel REIT – Residential Real Estate – Diversified
REIT – Industrial REIT – Retail Real Estate Services

The Hidden Strengths of REITs

REITs are unique as they distribute most of their income. In fact, they exist to pay generous distributions. This makes them one of the retirees’ favorite sectors!

Therefore, it’s easy to understand how most offer a relatively high dividend income. This is one of the rare sectors where you can find “relatively safe” stocks paying 5%, 6%, or even 7%+. Investors must be careful not to get too greedy, though. We have seen several REITs cut their dividends due to poor management or economic downturns.

REITs usually bring stability to a portfolio. It’s a great sector to start with if you want additional income. Real estate brings significant diversification to your portfolio. Research has proved that REITs are not directly correlated to stock market movements over the longer term.

Finally, since most of them operate with escalator contracts, they offer great protection against inflation. Many income trusts include yearly rent increases in their leases to ensure rental income matches inflation. Some REITs also use Triple-Net leases, where the tenants is responsible for insurance, taxes, and maintenance costs, thus reducing the REITs’ expenses (and risk of unexpected charges!).

REITs: The Risks You Need to Know

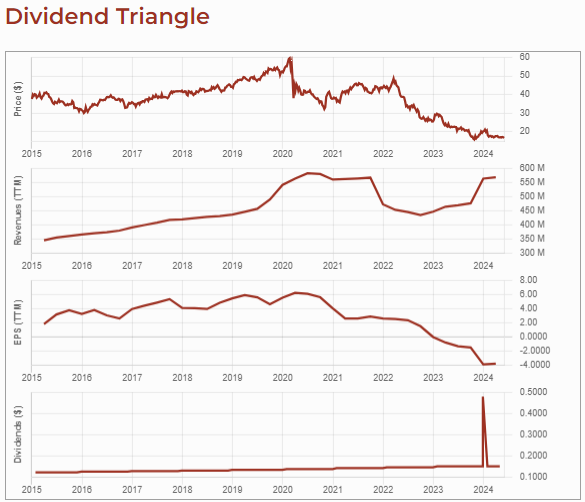
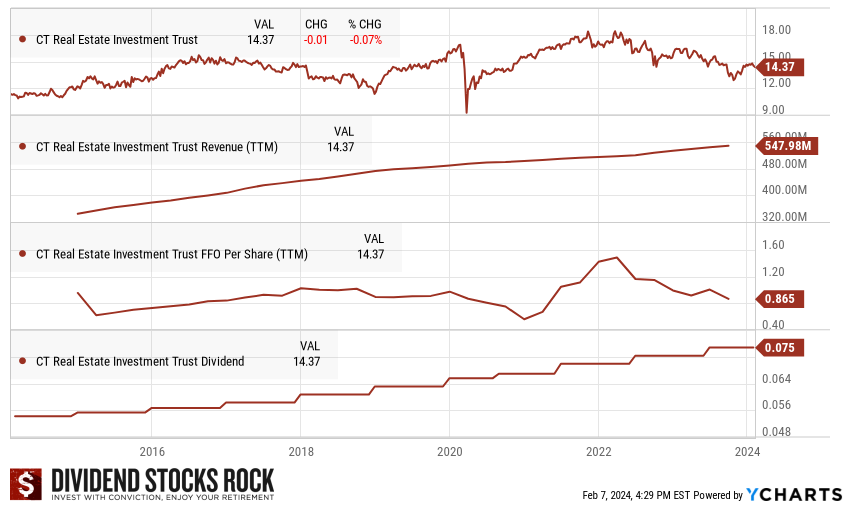
One of the REIT sectors’ favorite ways to finance their new projects is to issue more units. Therefore, if a company purchases a property generating $20M per year but needs to issue more units to finance the purchase, you must look at the net outcome for unitholders. If the FFO per share drops, this is not necessarily good for you as it will affect the REIT’s ability to increase its dividend in the future.

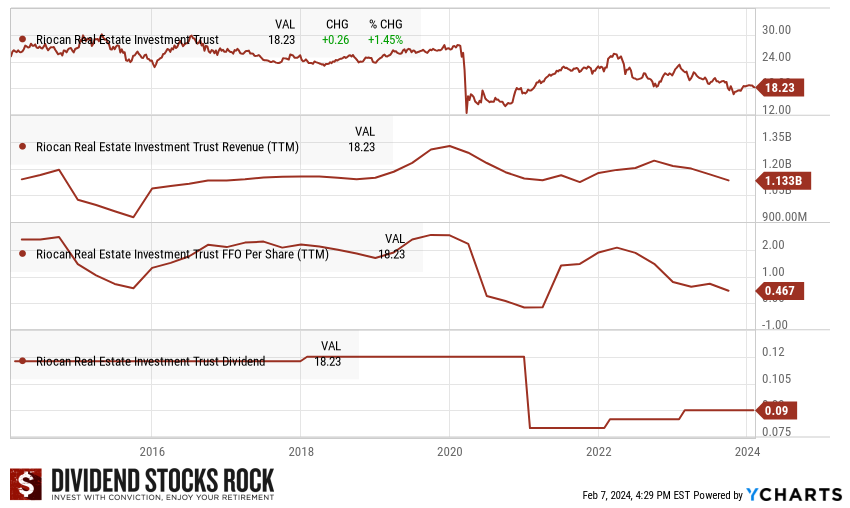
Another downside related to their business model is their lack of flexibility. We have often seen REITs try to shift their focus from one industry to another. In most cases (H&R, RioCan, Boardwalk, and Cominar, to name a few), the trajectory change comes with a dividend cut and a loss in value for unit holders. A REIT wishing to get rid of its shopping malls to buy more industrial properties will likely have to sell properties at a lower price and pay a hefty price to buy more appealing assets.

Finally, don’t make the mistake of thinking REITs are safer than other sectors. They are companies facing challenges while benefiting from tailwinds. While you may argue that an apartment building can’t go anywhere, I would answer that if you have one hundred empty apartments due to an oversupply in a neighborhood, your money will also go nowhere.

The REIT sector is best for income investors.

Target sector weight: For income-seeking investors, you can aim at 15% to 30% (if you invest in various industries). For growth investors, REITs could represent a 5%-15% portion of your portfolio.

Protect Your Portfolio: Canadian Rock Stars List

REITs can provide good income, but they are all part of the same sector. You need more diversification for your portfolio to be fully protected of market events.

Red star.

I have created a list showing about 300 companies with growing revenue, earnings per share (EPS), and dividend growth trends. Focusing on trends rather than numbers gives you a better perspective on past, present, and future growth.

The Dividend Rock Stars List is the best place to start your stock research. Get it for free by entering your name and email below.

How to Analyze a REIT (The 3 Must-Know Metrics)

While REITs are among a short list of sectors that are perfect for retirees or other income-seeking investors, it is important to understand that they cannot be analyzed using the same metrics as other sectors.

Funds From Operations (FFO/AFFO)

The Funds from Operations (FFO) and Adjusted Funds from Operations (AFFO) are probably the most valuable tools for analyzing a REIT’s financial performance. Those two metrics replace the earnings and adjusted earnings for a regular stock. While those are different metrics, it’s all about cash flow and the REITs’ ability to sustain their dividend payments.

Fortunately, we can find those metrics inside each REIT’s quarterly report and subsequent press release. It’s important to follow not only the total FFO/AFFO, but also the FFO/AFFO per share (or unit of ownership) rather than earnings per share (EPS) or adjusted earnings per share.

FFO = Earnings + Depreciation (Amortization) – Proceeds from Property Sales

AFFO = Earnings + Depreciation (Amortization) – Proceeds from Property Sales – Capital Expenditures

Loan to Value Ratio (LTV)

The loan-to-value ratio (LTV) is a great tool for analyzing the REIT’s future ability to raise low-cost capital. The LTV is easy to calculate from the financial statement, as you only need 2 measures of data:

LTV = Mortgage Amount / FMV of properties

You don’t want to invest in a REIT showing a high LTV. This means that their credit rating may be at risk and the price for future debt will be higher. In other words, it could mean less money for future dividends.

Net Asset Value (NAV)

The last metric to follow for REITs is Net Asset Value (NAV), which (usually shown in units) is equivalent to a price-to-book ratio.

NAV = Total Property Fair Market Value – Liabilities

The idea is to compare a few REITs from your list against one another. This is how you should be able to find the ones with the best metrics. A lower than industry NAV is either a riskier play or a value play. The AFFO and LTV will tell you which one it is.

Avoid This Common REIT Mistake

REITs are required to distribute at least 90% of their taxable income to investors, which makes traditional payout ratios less useful. The metrics you’re looking for is the Funds From Operations (FFO) and the Adjusted Funds From Operations (AFFO) payout ratios.

Funds from Operations Payout Ratio

Formula: DIVIDEND PER SHARE (DPS) / (ADJUSTED) FUNDS FROM OPERATIONS (FFO) PER SHARE

Because of REITs’ tax structure, adjusted funds from operations (AFFO or FFO) is a more precise metric. Like the payout and cash payout ratio, it’s always preferable to look at a long-term trend of the metrics over several years.

Pros: Similar to the cash payout ratio, this ratio clearly shows how much cash the company has to pay dividends.

Cons: In most cases, you can’t calculate the FFO payout ratio yourself or find it on general finance websites. You must rely on the company’s information found in their quarterly earnings reports. It requires additional time to establish a trend over several years.

How to Value a REIT Like a Pro

Valuing a REIT is like valuing any stock.

I generally use the Dividend Discount Model (DDM) to value them. However, some of the other REIT-specific metrics we’ve seen are also very valuable when valuing REITs.

Net Asset Value (NAV) is another estimate of intrinsic value. It’s the estimated market value of the portfolio of properties. One way to evaluate this value is to divide the current net income from the properties by a capitalization rate that’s fair for those types of properties. NAV can potentially understate the value of the properties because it might not capture value appreciation of properties during strong growth periods in the market. Compare the NAV to the price of the REIT.

We’ve seen that Funds from Operations (FFO) are far more important than net income for a REIT. Due to the tax structure of REITs, earnings mean almost nothing; instead, it’s all about cash flow. When calculating net income, depreciation is subtracted from revenues; depreciation is a non-cash item and might not represent a true change in the value of the company’s assets. FFO adds depreciation back to net income, providing a better idea of the cash income for a REIT.

Adjusted Funds from Operation (AFFO) is arguably the most accurate income measurement metric for REITs. AFFO takes FFO but then subtracts recurring capital expenditures on maintenance and improvements. It’s a non-GAAP measure but a very good gauge of the actual profitability and amount of cash flow available to pay out in dividends.

Overall, it’s good to look for REITs that have diversified properties, strong FFO and AFFO, and a good history of consistent dividend growth.

REIT advantages and disadvantages

Before presenting some of our picks for Canadian REITs, let’s sum up the advantages and disadvantages of REITs.

Advantages:

  • Usually have above-average dividend yields.
  • Are good protectors from inflation. Property values and rents increase over time if inflation occurs, but fixed-interest on the debt that finances the properties doesn’t.
  • Real estate, if managed conservatively, can be a reliable investment for income and in times of recession, assuming tenants pay their rent.

Disadvantages:

  • Often have lower dividend growth than companies in other sectors.
  • Generally use debt to add to their property portfolio, but their larger debt loads is used for conservative, appreciating assets.
  • Since they have to pay most of their income as dividends, they have little downside protection from recessions. They might have to trim the dividend if their cash flow dips below their distribution levels. There are, however, some REITs that have good track records of consistent dividend growth, despite market downturns.

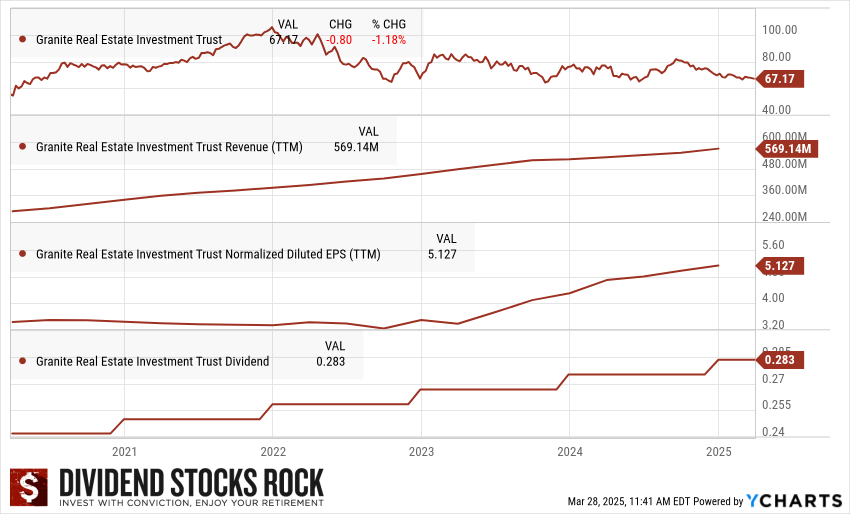
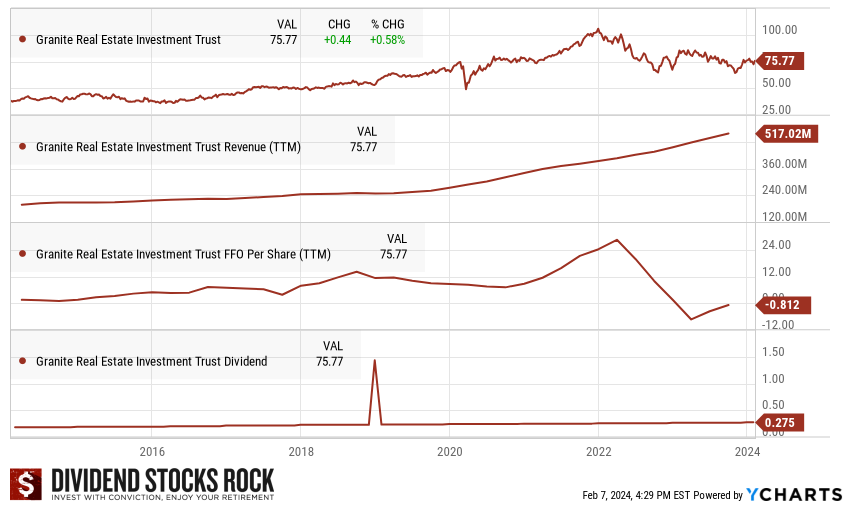
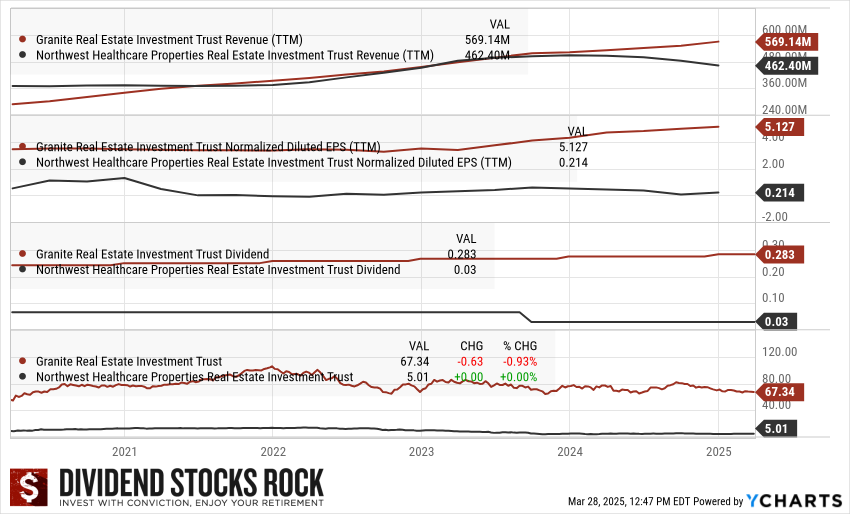
For example, Granite REIT has consistently used conservative debt and escalator leases to grow dividends. Conversely, Northwest Healthcare REIT stumbled due to poor balance sheet management, overreliance on floating rate debt, and deteriorating cash flow, leading to a dividend cut in 2023.

GRT.UN.TO vs NHW.UN.TO 5-Year Dividend Triangle.

REIT Summary or Quick Reference Table

✅ REIT Cheat Sheet
Best For: Income-focused investors, retirees.
Top Metrics: FFO/AFFO, NAV, LTV.
Risks: Overconcentration, debt levels, and tenant health.
Watch For: Dividend sustainability and inflation-adjusted leases.
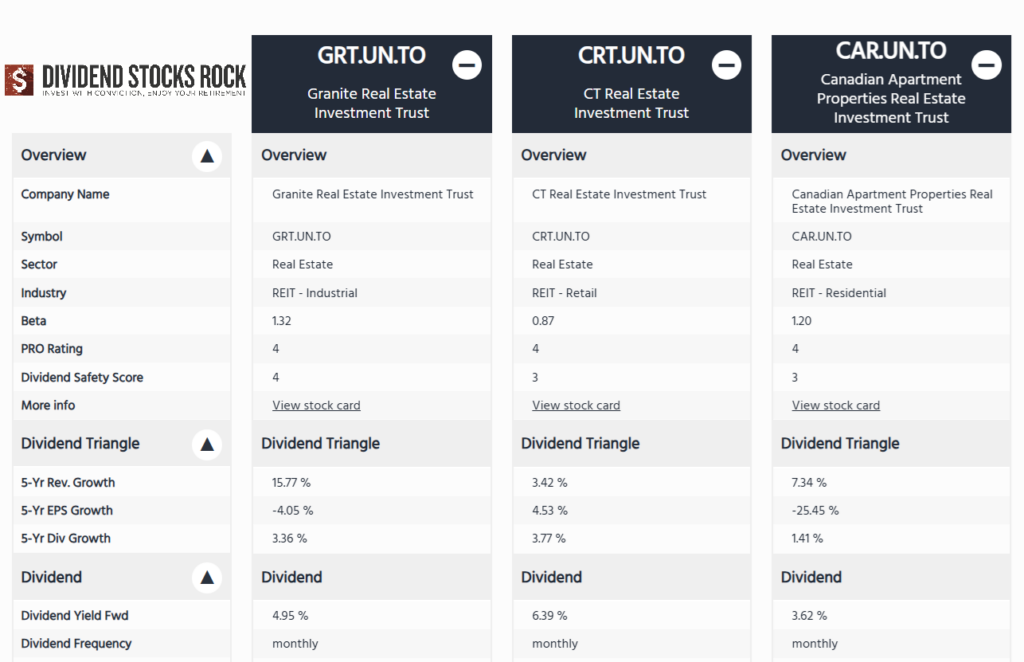
Top REIT Picks

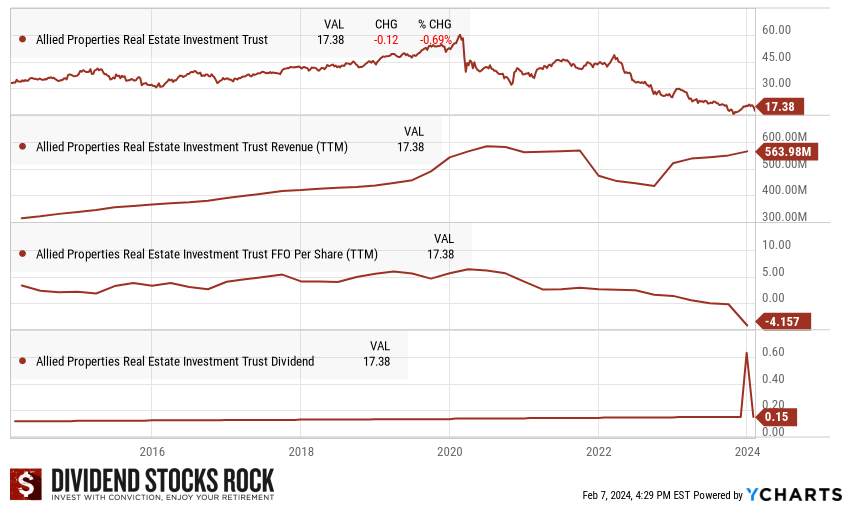
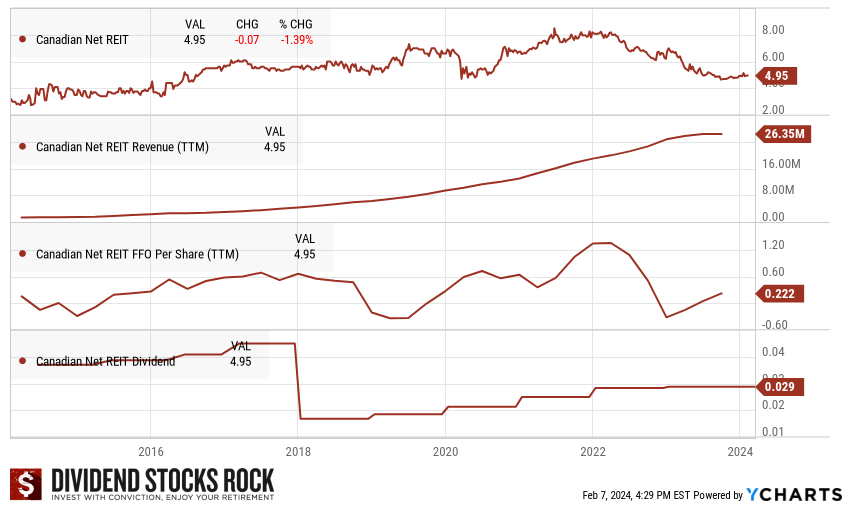
Below are some of my favorite REITs in Canada, side-by-side. You can also find a complete description for each in this article.

Our top 3 favorite monthly REITs using the Stock Comparison Tool at Dividend Stocks Rock.

Get More Stock Ideas: The Canadian Rock Stars List

Red star.

REITs can anchor your income portfolio — but they’re just one piece of the puzzle.

Explore our Canadian Rock Stars List to discover 300 dividend-growing stocks showing a positive dividend triangle (5-year revenue, earnings per share (EPS), and dividend growth trends) with filters.

Start your stock research on the right foot with the best Dividend Stocks List. Enter your name and email below.

Best Monthly REITs 2025

Retirement’s knocking — but can your income keep up? If you’re dreaming of monthly paychecks without the headaches of tenants or property repairs, Canadian REITs could be your answer.

Most dividends come quarterly. But some REITs? They pay monthly, giving you that steady stream of income retirees love.

What makes REITs great monthly payers?

While most companies pay dividends quarterly, many Canadian REITs opt for monthly distributions. That’s because their rental income arrives monthly — and they’re happy to share it.

Think of REITs like owning a rental empire — without the late-night repair calls. These trusts collect rent monthly from dozens (or hundreds) of properties and pass that income straight to you.

Monthly distribution REITs list

Monthly distribution REITs
Monthly distribution REITs in Calendar (for entertainment purposes only).

At DividendStocksRock, we track over 1,200 dividend-paying stocks. Only 65 Canadian companies pay a monthly dividend from this list, and over half (34) are REITs.

Want to explore all your monthly income options? Here’s our complete list of Canadian REITs that pay monthly dividends, including their yields and dividend growth history.

Retirees: Not All Income Is Created Equal

Monthly distributions can feel safe — until they’re not. High-yield funds often cut payouts when you need them most.

Dividend Income for Life shows you a better way:
✅ Reliable, growing income from quality dividend stocks
✅ A strategy built to outlast market dips and inflation
✅ How to retire with income you won’t outlive

💡 If you’re retired (or close to it), this guide is your roadmap to income that grows with you.

Download it free and build the income your retirement deserves.

Our Top 3 Monthly REITs

Some of the best Canadian REITs are paying a monthly distribution. We picked three standouts from over 30 monthly-paying REITs based on yield stability, tenant diversification, debt or payout ratios, and long-term growth.

Granite REIT (GRT.UN.TO)

GRT.UN.TO 5-Year Dividend Triangle.

Investment Thesis: Diversified, Disciplined, and Growing

Granite REIT has transformed from a single-tenant industrial landlord into a diversified, growth-oriented real estate investment trust.

Once dependent on Magna International for 98% of its revenue, that figure has dropped to 26.7% as of August 2024. The trust now owns 143 properties across seven countries, with a growing tenant base including Amazon. Backed by a BBB/BAA2 investment-grade rating and a low FFO payout ratio (~70%), Granite offers a 4–5% dividend yield with inflation-beating growth potential.

Strategic acquisitions and developments aligned with e-commerce and supply chain trends continue to fuel expansion and de-risk the portfolio.

Potential Risks: Magna Still Matters

Despite Granite REIT’s successful diversification, key risks remain—most notably its ongoing dependence on Magna, which still accounts for over a quarter of its revenue. Any disruption in Magna’s business could impact Granite’s financial stability.

Broader economic downturns could also reduce demand for industrial space, leading to lower occupancy and rent collections. Rising interest rates present a further challenge, potentially increasing borrowing costs and pressuring profit margins.

The industrial REIT space is also becoming increasingly competitive, with rivals like Dream Industrial and Stag REIT actively pursuing premium tenants and properties, requiring Granite to enhance its value proposition continuously.

CT REIT (CRT.UN.TO)

CRT.UN.TO 5-year Dividend Triangle.

Investment Thesis: High Yield, Low Risk, and Long Leases

CT REIT is a stable, income-focused real estate investment trust that derives 92% of its rental income from Canadian Tire and its associated brands.

With a robust 6.3% dividend yield and a conservative AFFO payout ratio (~74–75%), it offers reliable monthly income backed by long-term, triple-net leases. The REIT owns 375 properties across Canada and continues to grow through acquisitions, intensifications, and development projects.

While its fortunes are tied closely to Canadian Tire’s performance, the trust benefits from high occupancy, mission-critical assets, and strong pricing power on renewals—making it an appealing choice for conservative, yield-seeking investors.

Potential Risks: When Your REIT Depends on One Retailer

CT REIT’s stability comes with concentrated risk—over 90% of its leasable area is tied to Canadian Tire.

This tight dependency means the REIT’s fortunes rise and fall with its anchor tenant. While Canadian Tire has been resilient, any strategic shift or decline in its performance could have ripple effects on CT REIT.

The trust also faces exposure to interest rate risk due to its $3B+ in debt and operates many properties in secondary markets, which are more vulnerable during economic downturns.

Despite solid management and stable cash flows, CT REIT lacks diversification, making it a high-conviction bet on a single retailer.

Canadian Apartment Properties REIT (CAR.UN.TO)

CAR.UN.TO 5-year Dividend Triangle.

Investment Thesis: Stable Income with Rental Growth Upside

Canadian Apartment Properties REIT (CAPREIT) is a leading residential REIT with over 48,000 rental suites across Canada and the Netherlands.

Known for its inflation-resistant cash flows and strong occupancy (97.5% in Q4 2024), CAPREIT offers steady income and long-term growth potential. It has delivered high single-digit organic rent growth while engaging in capital recycling—selling nearly $1 billion in Canadian assets in 2024 to optimize its portfolio.

With strategic property acquisitions, strong demand in rental housing, and exposure to international markets, CAPREIT is well-positioned for continued performance amid a tight housing market and rising rental rates.

Potential Risks: From Strong Rents to Squeezed Margins

While CAPREIT remains a top residential REIT, it faces mounting headwinds from rising costs, regulatory risk, and economic uncertainty.

Same-property NOI growth slowed to 3.4% in Q4 2024, as maintenance and repair expenses climbed. A potential shift in Canadian immigration policy could weaken rental demand, while high interest rates continue to pressure REIT valuations and acquisition strategies.

CAPREIT also competes with other major residential REITs and faces new risks through its European exposure, including currency volatility and unfamiliar regulatory landscapes.

Future performance will depend on its ability to maintain occupancy, control costs, and adapt to a changing macro environment.

Each REIT has strengths — whether it’s Granite’s industrial edge, CT’s retail consistency, or CAPREIT’s rental growth. Consider what fits your income goals and risk comfort.

Those REITs are great, but there’s more!

Monthly REITs are a powerful tool — but they’re not the whole picture. Relying solely on high yields can be risky, especially if payouts get slashed.

That’s why we built ‘Dividend Income for Life’ — a strategy that balances immediate income with long-term stability.

Discover the Dividend Strategy Built for Real, Long-Term Income

If you’re counting on monthly distributions to fund your retirement, there’s something you need to know: many of them aren’t sustainable. High yields can vanish overnight with a dividend cut — leaving your income and peace of mind at risk.

That’s where Dividend Income for Life comes in.

This free guide reveals a disciplined, proven strategy to build income from dividend stocks that grow over time — not just pay today.

Inside, you’ll learn:

✅ Why monthly income funds can be misleading (and what to use instead)
✅ The secret power of low-yield, high-growth stocks to protect your income
✅ How to build a portfolio that grows your cash flow and preserves your capital
✅ Real data: how dividend growers crushed high-yield stocks over the last decade
✅ A smarter withdrawal approach to make your money last

🛡️ Don’t trade short-term comfort for long-term risk.
Build a dividend income stream designed to last – and grow – for life.

👉 Download your free copy now and take control of your retirement income.

High-Risk High-Reward Stock for June 2024: Allied Properties REIT (AP.UN.TO)

On my buy list since April 2023, Allied Properties REIT (AP.UN.TO) has moved to the top on that list for Canadian stock paying a yield of 4% or more. Allied Properties is still not getting a lot of love from the market due to the negative sentiment around the real estate sector, and even worse for office properties. We continue to believe that AP is a very interesting play. Its stock price decline makes it a good entry point for investors interested in a speculative real estate stock. This is a falling knife—high risk, high reward—so proceed with caution.

Create and manage your own dividend income portfolio. Learn how in our Dividend Income for Life Guide.

Allied Properties Business Model

Allied Properties is a Canada-based open-end real estate investment trust (REIT). It owns and operates unique urban workspaces in Canada’s cities and network-dense urban data centers in Toronto.

It provides knowledge-based organizations with distinctive urban environments for creativity and connectivity. Allied Properties operates in seven urban markets in Canada: Montreal, Ottawa, Toronto, Kitchener, Calgary, Edmonton, and Vancouver.

Allied engages in third-party property management business, providing services for properties, in which a trustee of Allied Properties has an ownership interest.

AP.UN.TO Investment Thesis 

Allied features one of the strongest balance sheets among Canadian REITs. It has much of its capital invested in low-cost projects and is currently paying down higher-interest debt while simultaneously investing in new projects.

Allied Protperties REIT (AP.UN.TO) logo and several pictures of propertiesAP.UN.TO maintains its unique expertise in managing and developing prime heritage locations, which will continue to be in high demand in the coming years. The REIT also counts on many technology clients, which represent a growing sector in Canada.

There are still concerns surrounding office REITs, but Allied Properties has proven its resilience in difficult times. The 2023 distribution increase (+2.7% in early 2023) and low payout ratio for a REIT were good signs.

AP remains a high-risk, high-reward play; investors must do their due diligence and monitor the occupancy rate and FFO per unit growth.

AP.UN.TO Last Quarter and Recent Activities

Allied Properties did well in its most recent quarter, all things considered, with revenue up 4%, and Adjusted Funds from Operations (AFFO) per unit up 1%. The AFFO payout ratio for the quarter stands at 83.8%. Same Asset NOI (net operating income) from Allied Properties’ rental portfolio was down 2% while Same Asset NOI from its total portfolio was up 2.9%, reflecting the productivity of its upgrade and development portfolio.

AP.UN.TO’s occupied and leased area at the end of the quarter was 85.9% and 87%, respectively. This was lower than the previous quarter. We wish we would see this number go above 90%. Allied Properties remains a speculative play. Below is Allied Properties’ dividend triangle showing the falling stock price but revenue going back up. As always with REITs, look to FFO or AFFO per unit rather than EPS.

Allies Properties REIT (AP.UN.TO) dividend triangle

Potential Risks for AP.UN.TO

Most of Allied Properties’ income is derived from office properties. We know how the pandemic left a dent in the real estate market, especially for office space. Some workers were eager to return to the office, while others weren’t willing to. Many enjoy working from home and the way we work may be forever changed. There will be demand for quality office buildings, but how we will use offices in the coming years remains uncertain, and parking revenues might be weaker going forward.

AP.UN.TO’s properties are mostly located in Ontario (Toronto) and Quebec (Montreal). This limited geographic diversification can leave it vulnerable to economic changes in these provinces. We saw in their latest quarterly update that both regions had been affected. Fortunately, smaller markets such as Calgary and Vancouver showed strong occupancy rates. The global occupancy rate is at 87% for Q1 2024. We advise to not to enter a position unless you are willing to take the risk.

Create your own money-making machine. Learn how in our Dividend Income for Life Guide.

Allied Properties Dividend Growth Perspective

When evaluating a REIT, we look for dividend increases that at least match inflation. This is the case with AP.UN.TO. The company has a 2.5% dividend CAGR over the past 5 years and healthy FFO and AFFO growth. An investor can therefore expect 2-3% annual dividend growth going forward.

For the full year 2022, AP.UN.TO’s AFFO payout ratio was 81%. It increased its distribution by 2.7% in 2023 (after a 3% increase in 2022), for an annual distribution payment of $1.80/share. After paying its special distribution in December 2023, AP.UN.TO hasn’t increased its distribution increase yet in 2024 but still shows a healthy AFFO payout ratio of 80%. If AP.UN.TO’s distribution doesn’t increase by the end of 2024, it will lose its dividend safety score of 3 at Dividend Stocks Rock . Allied Properties pays a monthly distribution.

Final Thoughts on Allied Properties REIT

With still much uncertainty around office space use in the future and Applies Properties’ occupancy rate on a downtrend (87% in Q1 2024 vs. 87.3% in Q4 2023 vs 89.5% in 2022), this is a speculative play.

However, AP.UN.TO still has decent payout FFO and AFFO payout ratios (77.8% and 83.8% respectively), making its guidance sustainable. It boasts unique heritage properties in urban areas and clients in the growing technology sector. It also has a strategic objective to establish its urban rental-residential portfolio.

With its stock price at under $17, compared to $21 a year ago and $32 two years ago, and distribution increases matching inflation (though not yet in 2024), this falling knife could be an interesting real estate play. Again, potential high reward, but high risk!

High Yield Canadian REITs

REITs are companies primarily engaged in Real Estate and source most of their income from rents. To qualify as REITS (tax purposes) they need to distribute more than 90% of their net income to shareholders. This amongst other factors makes REITs a great option for income seekers looking for stable and decent dividends. At DSR we track 47 Canadian REITS! From that list, today we will be covering some of the higher-yielding companies (over 5% dividend yield). Although this might sound very appetizing make sure you do your due diligence because high yield is not always the same thing as high quality.

  1. Make sure you find a healthy dividend growth rate in the last few years (at least 5 years). If the company is increasing dividends at a rate lower than inflation, it means every single year you are getting a smaller paycheck.
  2. Some of these higher-yielding companies could also be dividend traps just looking to attract investors and their dividend is not sustainable, that is why you need to make sure you take a close look at the payout ratio (remember with REITs you use funds from operations (FFO) and not net income).
  3. Last but not least take a look at their track history, have they cut dividends in economic downturns? If they have how fast did they recover? This could give you an idea of what to expect next time things get rough for these companies.

For more REIT investing guidelines, please refer to the Canadian REITs Beginner’s Guide.

BTB REIT (BTB.UN.TO)

Market Cap: $271M

Dividend Yield: 9.14%

Subsector: Diversified (Retail, Office, and Industrial)

BTB high yield REIT

BTB Real Estate Investment Trust (the Trust) is a Canada-based real estate investment trust (REIT). The objective of the REIT is to generate stable and growing cash distributions on a tax-efficient basis from investments in a diverse portfolio of income-producing properties, with a primary focus in Quebec; to expand the real estate asset base of the REIT and increase its income available for distribution through an accretive acquisition program, and to enhance the value of the REIT’s assets and maximize long-term Unit value through the active management of its assets. The Trust owns approximately 75 properties, representing a total leasable area of approximately 5.9 million (M) square feet. It is an owner of properties in eastern and western Canada. It also offers a distribution reinvestment plan to unitholders. The Company operates through three segments, namely Industrial, Off downtown core office, and Necessity-based retail.

In September, BTB REIT reported strong revenue growth (+11%), but failed to reflect this performance in its AFFO per unit (-7%). Revenue growth was driven by strong rental activity and recent accretive acquisitions. Furthermore, BTB’s net operating income increased by 13% and its leasing efforts improved the occupancy rate of the properties by 1.6% compared to the same quarter of 2021. AFFO per unit was down due to a one-time additional recovery of $2.6M and an indemnity collection thereby increasing the revenues for that period last year. The dividend is safe with an AFFO payout ratio of 65.5% for the quarter and 67.8% for the first six months of the year.

Slate Grocery REIT (SGR.UN.TO)

Market Cap: $783M

Dividend Yield: 9.20%

Subsector: Retail (Grocery)

SGR.UN Canadian REIT

It is known that we are not fans of brick-and-mortar REITs at DSR. However, Slate Grocery REIT focuses solely on grocery-anchored commercial properties, which are generally buffered against the competition from e-commerce. The REIT counts Walmart (6.2% of base rent) and Kroger (8.1%) as its top tenants. We also like SGR’s geographic diversification across Florida (15.5%), North Carolina (14.1%) and Pennsylvania (10.4%). This combination of strong tenants and good geographic diversification has led to a high rent collection rate in 2020. Slate Grocery boasts a defensive portfolio of tenants including 64% of its base rents linked to groceries (38%), essential services (14%), or medical and personal services (13%). Despite its strengths, this REIT still has a weak dividend growth policy.

In August, Slate Grocery REIT reported good growth this quarter (revenue up 18%, AFFO per unit up 5%). This brought the AFFO payout ratio from 100% last year to 98%. On July 15, 2022, the REIT completed the acquisition of 14 properties for $425 million, which represents a low acquisition basis of $174 per square foot with below-market rents. The Portfolio increases the REIT’s exposure to the rapidly growing Sunbelt Region of the U.S. and includes a wide range of high-performing grocers, including Publix, Ahold Delhaize, Albertsons, and Walmart Occupancy has increased by 20 basis points since the most recent quarter to 93.4%.

Smart REIT (SRU.UN.TO)

 Market Cap: $4.37B

Dividend Yield: 7.20%

Subsector: Diversified (Retail, Multifamily, Office, and Self-Storage)

SmartCentres REIT

SmartCentres’ strengths lie in its long-term partnerships with retail giants such as Walmart, Canadian Tire, TJX and Loblaws. We like how SRU has integrated drugstores and grocery stores into each mall. This ensures a constant flow of customers for all the other retailers. SRU doesn’t just count on its strong relationships with stellar tenants to ensure growth. Management has recently increased its focus on 5G towers, EV charging stations, and pickup services (to compete against e-commerce). SRU also has an “intensification plan,” where it will develop various property types (residential, hotels, office buildings, etc.) in fast-growing cities. SRU is in the midst of an ambitious expansion and diversification project where a total of $15B will be invested. This is a great way to ensure diversification away from large retailers going forward. SmartCentres’ intensification program is expected to produce an additional 58.6 million square feet of space.

In September, SmartCentres reported a good quarter with revenue up 2% and FFO up 6%. The payout ratio for the quarter is at 90%, down from 99% last year. If the REIT continues on this track, we could talk about a distribution increase next year. Shopping centre leasing activity continues to improve with occupancy levels, inclusive of committed deals, increasing to 97.6% in Q2 2022, representing a 40 basis points increase from Q1 2022. SRU received zoning approvals for over 3.8 million square feet of residential development in the second quarter on 3 projects in the Greater Toronto Area.

Truth about REITs

As you can tell, finding the perfect REITs for your portfolio is not an easy task. Especially when looking for high-yield REITs, there are a lot of factors that you need to consider in order to be able to sleep well at night. You want to add to your portfolio a stable business with enough growth to at least beat inflation. If you get down to the weeds, looking at the actual portfolio and its growth might be a good resource to look into the future. At DSR we give you the tools to make sure you put your money to work with stable and growing companies so you can enjoy your passive income on the things that matter most!

Those REITs are great, but there is more!

We are now in market correction territory, and the fear of losing more money is growing. What will happen if we keep up with continuous high inflation?

If you look at past performances, Real Estate Income Trust is one of the best performing classes during high inflation periods since the 70s. Unfortunately, not all REITs are created equal and you must do adequate research to make sure you buy the right ones.

In this webinar, I will answer questions like:

  • How about REITs paying a 10% yield
  • How to make sure the REIT’s distribution is safe
  • Which metrics to consider during my analysis?
  • Should I consider mortgage REITs?
Watch the free Webinar replay here

Best Canadian REITs with a Safe Dividend

Real Estate Income Trusts or REITs are known to be retirees’ best friends. Why? Because they share several key factors for income-seeking investors. Notably, Canadian REITs are known for the following:

  • Their generous dividend yield (may offer a yield over 3%)
  • Many pay their distribution monthly (fits well with your budget!)
  • REITs operate stable businesses (recession-proof!)
  • Their goal is to distribute as much money as possible (isn’t what you are looking for?)
  • They are an excellent inflation hedge! (most of them have contracts with escalators clauses).

Before we jump to the Best Canadian REITs

While REITs are great to generate income at retirement, they can’t be analyzed using the same metrics as dividend stocks. For example, REITs don’t pay dividends, they pay a distribution that could be a mix of dividend, return of capital, and income. Therefore, REITs distributions are not eligible for the tax credit! Don’t worry, if you invest in a registered account such as an RRSP or a TFSA, you’re all good.

Besides their distribution, there are other characteristics that make REITs a unique investment type. Here are a few of them.

REITs valuation

Valuing a REIT is like valuing any stock. I generally use the Dividend Discount Model, since most of their profits are paid as dividends.

There are, however, a few key metrics to know.

Net Asset Value (NAV) is another estimate of intrinsic value. It’s the estimated market value of the portfolio of properties, and it can be determined by using a capitalization rate on the current income that is fair for those types of properties. This can potentially understate the value of the properties because properties may appreciate rather than depreciate over time.  Compare the NAV to the price of the REIT.

Funds from Operations (FFO & AFFO)

The Funds from Operations (FFO) are far more important than net income for a REIT. To determine net income, depreciation is subtracted from revenues. Since depreciation is a non-cash item, it might not represent a true change in the value of the company’s assets. FFO calculation adds back depreciation to net income to provide a better idea of what the cash income is for a REIT.

Adjusted Funds from Operation (AFFO) is arguably the most accurate form of income measurement of all regarding REITs since it takes FFO but then subtracts recurring capital expenditures on maintenance and improvements. It is a non-GAAP measure, but a very good measure for the actual profitability and the actual amount of cash flow that is available to pay out in dividends.

So rather than look to Earning per Share (EPS), which is calculated using net income, for REITs, look for the FFO per unit or AFFO per unit.

Overall, it is good to look for REITs that have diversified properties, strong FFO and AFFO, and a good history of consistent dividend growth.

Top 3 Largest Canadian REITs

One way to classify REITs is by market cap. Many investors feel more comfortable selecting a well-diversified business with a large property portfolio. Some REITs are present in many cities and provinces providing optimal geographic diversification. Here are the three largest Canadian REITs:

Canadian Apartment Properties REIT (CAR.UN.TO)CAPREIT Logo

  • Market Cap: 8B
  • Dividend Yield: 3.06%
  • Sub-Sector: Residential

If an investor is looking for a steady source of income that will keep up with inflation, CAPREIT should be on their watchlist. In addition to enjoying a strong core business in Canada, CAPREIT is expanding its business in Ireland and the Netherlands. This gives them additional geographic diversification. CAPREIT continues to exhibit high-single-digit organic growth while raising additional funds to acquire more buildings. Unfortunately, the REIT neglected to increase its dividend in 2020. We cannot blame management for being overly cautious over the pandemic; they were fortunately stronger in 2021 and won back their dividend safety score of 3.

Graphs showing Canadian Apartments REIT's stock price, revenue, FFO per share and dividends paid over 5 years

Dividend Growth Perspective

Over the past 5 years, management has been able to steadily increase its monthly distribution. The REIT continued its dividend growth tradition with a modest increase in 2019 (+3.6%). Management has proven its ability to grow its revenue both organically and through acquisitions. After taking a pause in 2020, CAPREIT came back with a generous dividend increase (+5.2%) from $0.115 per share to $0.121 per share earlier in 2021. The REIT won back its dividend safety score of 3 as it exhibits a strong FFO payout ratio of 62.6% for the full year of 2021. You can expect another dividend increase in 2022! The recent stock price drop brought the yield to about 3%; this looks like a good deal if you are prepared to be patient (e.g., expect more volatility throughout the rest of the year).

RioCan REIT (REI.UN.TO)

  • Market Cap: 5.5B
  • Dividend Yield: 5.9%
  • Sub-Sector: Retail

The REIT boasts an impressive occupancy rate. Over the past couple of years, REI sold non-core assets to concentrate on what they know best. We like management’s new focus, and we think it will help build additional value for investors into the future. RioCan can count on solid growth going forward, with 90% of its rents coming from the top 6 markets in Canada (with roughly 50% coming from the Greater Toronto Area).

Unfortunately, the REIT must face constant headwinds coming from the retail brick & mortar industry. For this reason, RioCan is pursuing residential urban development projects (80%+ of its current pipeline). This could be an interesting growth direction, but we wonder: will it be enough to compensate for the brick & mortar retail industry’s slowdown? In the meantime, REI increased its FFO per unit by 7% for the full year of 2022 and it has several projects in its pipeline. We see continuity in FFO per unit growth in 2023. The REIT exhibits a strong balance sheet and a low payout ratio.

Gra[hs showing Riocan's stock price, revenue, FFO per share, and dividends paid over the last 5 years

Dividend Growth Perspective

An investor shouldn’t expect much in terms of short-term dividend growth. When calculated using the DDM, we used a 3% dividend growth rate now that the REIT freed up some cash flow and increased its distribution by 6.25% in 2021. Let’s hope that their plans to expand into offices and apartment buildings will be profitable. The FFO payout ratio will be in line, but we expect RioCan to be more prudent with its cash flow. As expected, the REIT offered a dividend increase in 2023 (+5.88% from $0.085/share to $0.09/share).

Granite REIT (GRT.UN.TO)

Granite REIT logo

  • Market Cap: 4.8B
  • Dividend Yield: 4.41%
  • Sub-Sector: Industrial

GRT used to be an extension of Magna International (MG.TO). In 2011, Magna represented about 98% of its revenues. It is now down to 25% as of November 2023 (with Amazon as its second-largest tenant with 4% of revenue). You’ll notice that each year, GRT reduces its exposure by a few percentage points. Management has transformed this industrial REIT into a well-diversified business without adversely affecting shareholders. GRT now manages 138 properties across 7 countries. Each time we review this stock card, the number of properties increases while the exposure to Magna Intl reduces. The REIT also boasts an investment grade rating of BBB/BAA2 stable. With a low FFO payout ratio (around 70-75%), shareholders can enjoy a 5% yield that should grow and match or beat the inflation rate. This is among the rare REITs exhibiting AFFO per unit growth while issuing more units to finance growth.

Graphs of Granite REIT stock price, revenue, FFO per share and dividends paid over 5 years

Dividend Growth Perspective

GRT has maintained a solid dividend growth policy over the past 5 years (4%+ CAGR). With its FFO payout ratio well under control shareholders should expect a mid single-digit dividend growth rate going forward. The AFFO payout ratio was under 73% for Q3 2023 (reported in November 2023). You can expect more distribution increases going forward! The company even paid a special dividend in 2019. If the Magna International business is doing well, GRT will perform and keep increasing its dividend. The REIT offered a conservative distribution increase in November of 2023 with a raise of 3.125%.

We issued a buy rating on Granite a while ago. Even with the stock price bouncing back a bit, it’s still a buy.

Highest Yield REITs

If you are retired, your main concern may be how much income your portfolio can generate. In this case, you may be interested in finding out the most generous REITs. A word of caution, a very high yield isn’t necessarily a sign that all is  great, always make you due diligence when researching REITs to choose the best and safest. More information about that later in this post.

AP.UN.TO logoAllied Properties REIT (AP.UN.TO)

  • Market Cap: $2B
  • Dividend Yield:10.29%
  • Sub-Sector: Office

Allied features one of the strongest balance sheets among Canadian REITs. It has much of its capital invested in low-cost projects and is currently paying down higher-interest debt at the same time as investing in new projects. AP maintains its unique expertise in managing and developing prime heritage locations, which will continue to be in high demand in the coming years. The REIT also counts on many technology clients, which represent a growing sector in Canada. There are still concerns surrounding office REITs (AP generates ~70% of its income from offices), but this REIT has proven its resilience in difficult times. The 2023 distribution increase (+2.7% in early 2023) and low payout ratio for a REIT are good signs. AP will sell its data centers to bank highly valued assets in order to purchase more undervalued ones (office properties). This could be a very strong move. However, AP remains a high-risk, high-reward play, but please proceed with caution.

Graphs of Allied Properties REIT's stock price, revenue, FFO per share, and dividends paid over the last 5 years

Dividend Growth Perspective

In evaluating a REIT, we hope that the dividend increase will at least match inflation. This is the case with AP. The company has posted a 2.5% dividend CAGR over the past 5 years and exhibits healthy FFO and AFFO growth. An investor can therefore, expect 2-3% annual dividend growth going forward. For the full year of 2022, the REIT exhibits an AFFO payout ratio of 81%. Allied increased its distribution by 2.7% in 2023 (after a 3% increase in 2022), bringing its annual distribution payment to $1.80/share. This demonstrates strong confidence from management and pleasant news for shareholders! However, it doesn’t mean it’s a smart move…

Canadian Net REIT logoCanadian Net REIT (NET.UN.V)

  • Market Cap: $102.7M
  • Dividend Yield:6.87%
  • Sub-Sector: Diversified

This is an interesting small REIT that has flown under the radar. Canadian Net REIT enjoys stable cash flows from its properties under the triple net lease formula (tenants handle insurance, taxes, and maintenance costs). Triple net lease REITs let tenants manage more risk as they handle all expenses involving the property. The REIT has high quality tenants such as Loblaws (25% of NOI), Walmart (11%), Sobeys (10%), Suncor (7%) and Tim Hortons (6%). The REIT’s portfolio makes this company quite resilient to any kind of recession. The bulk of its properties are situated in the province of Quebec, with a small number in Ontario and the Maritimes. We should keep in mind that the company trades on the TSX Venture. This small cap (approximately $100M of market capitalization) is subject to low trading volume and strong price fluctuations. Monitor this one quarterly to make sure the situation remains stable. Always proceed with caution with small caps.

Graphs showing Canadian Net REIT's share price, revenue, FFO per share, and dividends paid over the last 5 years

Dividend Growth Perspective

Don’t be alarmed by the dividend drop in 2018, as the REIT simply changed its payment schedule. In fact, this small cap has been continually increasing its dividend since its IPO in 2011. The FFO payout ratio hovers between 55% and 65% as their FFO per unit grew just as quickly as its dividend in the past decade (in fact, it grew even faster). Unfortunately, while management claims the distribution is safe with a payout ratio of 62%, it didn’t announce an increase. Following the small increase of 2023 (+3.6%) and no increase for 2024, the REIT is likely going to lose its dividend safety score of 3 if it doesn’t increase its distribution later in 2024. Revenue increased through higher rental income, but higher interest charges affected the FFO. Proceed with caution with this small cap.

CT Real Estate Investment Trust logo

CT REIT (CRT.UN.TO)

  • Market Cap: 2BM
  • Dividend Yield:6.25%
  • Sub-Sector: Retail

An investment in CT REIT is primarily an investment in Canadian Tire’s real estate business. If you think this Canadian retail giant will do well in the future, but you are more interested in dividends than pure growth, CT REIT could be a good fit for you. Canadian Tire has exciting growth plans that will eventually lead to more triple-net leases for CT REIT. The fact that CRT pays a monthly dividend with a 6% yield is highly attractive to income-seeking investors. On top of that, CT REIT exhibits a decent dividend growth rate policy, matching and beating inflation over the long haul. In the past 10 years, the company grew its revenue and AFFO by mid-single digits numbers. This makes it a perfect candidate for an income-focused portfolio. Canadian Tire has done well in the past 5 years thus far and has proven the resilience of its business model. It’s a sleep well at night REIT that should please all income-seeking investors.

Graphs showing CT REIT's stock price, revenue, EPS and dividends paid over 5 years

Dividend Growth Perspective

This REIT continues to grow and maintain a low AFFO payout ratio of 75% for full year 2022. The AFFO payout ratio for the first nine months of 2023 is at 73.2% (slightly below 2022 numbers). This means your distribution will likely continue to increase faster than the inflation rate going forward. Shareholders can expect to cash in a solid 6% yield with a ~3% growth rate. This is a perfect example of a sleep-well-at-night type of holding. After a small increase in 2020 (+1.5%), CT REIT came back strong with increases of 4.5% and 3.3% in 2021 and 2022, respectively. Keep in mind that many retail REITs cut their dividend over the pandemic. CT REIT has proven that an investor can trust the company to be part of their retirement plan. CT REIT rewarded investors with another 3.5% distribution increase in 2023. Even with a conservative DDM calculation (expected dividend growth of 3%), the REIT offers an attractive entry point at a price below $15.

My Favorites 

Finding the perfect REITs isn’t easy. As a dividend growth investor, I look for a combination of a stable business with some growth perspective. I like when management can grow their property portfolio through investments and acquisitions while increasing distributions enough to beat inflation. I found this perfect balance among these three Canadian companies, which happen to be either among the largest or the highest-yield REITs we covered earlier in this post:

Granite REIT (GRT.UN.TO)(GRP.U)

CT Real Estate Investment Trust (CRT.UN.TO)

Canadian Apartment Properties REIT (CAR.UN.TO)

Learn how to invest in REITs

Unfortunately, not all REITs are created equal and you must do adequate research to make sure you buy the right ones.

Watch this webinar, in which I answer questions like:

  • How about REITs paying a 10% yield
  • How to make sure the REIT’s distribution is safe
  • Which metrics to consider during my analysis?
  • Should I consider mortgage REITs?
Watch the free Webinar replay here

Copyright © 2025 · Moose Markets