You’ve got money to invest. You want dividend income. You’re not afraid of putting in the work. But here’s the problem: you don’t know where to start.
Should you buy a few blue chips right away?
Wait for a correction?
How many stocks do you need?
Should they all be Canadian?
If this sounds familiar, I hear you. I’ve had this same conversation with dozens of investors—smart, experienced people who still feel stuck at square one.
That’s exactly why we built the DSR Investment Roadmap: a clear, actionable process to go from “cash in your account” to “fully invested in a rock-solid dividend portfolio.”
Here’s a sneak peek into how it works.

Step 1: Set Your Ground Rules
Before looking at tickers, you need a strategy—not someone else’s rules, but your own.
-
What’s your goal? Income now, total return over time, or a mix? Knowing this helps you prioritize growth vs. yield from the start.
-
How long are you investing for? A long-term mindset (think decades) puts corrections and bear markets into proper perspective.
-
What’s your ideal number of holdings? Most investors do best with 20–40 stocks—enough for diversification, not so many that tracking them becomes a full-time job.
-
Do you prefer high-yield or high-growth? Your preferences will shape your filters and the types of companies you review.
-
Are you more comfortable with banks or software companies? Focus on sectors you understand—you’ll make smarter decisions and avoid panic when markets swing.
These ground rules are like GPS coordinates: they keep you headed toward your destination.
Step 2: Start with the Right Filters
There are 9,000+ publicly traded companies. You only need 20–30. It’s time to shrink the list.
-
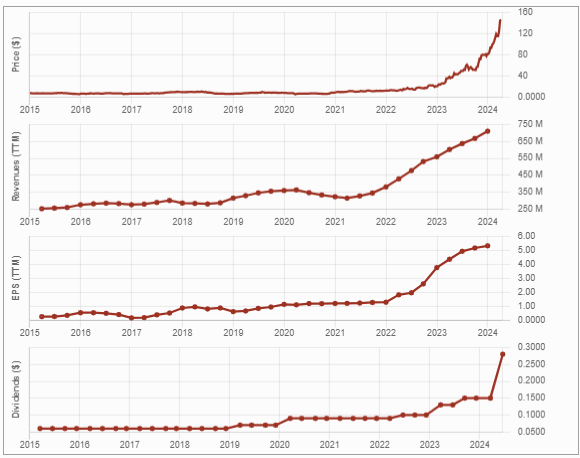
5-year revenue growth: Tells you if the business is actually expanding—not just cutting costs or buying back shares.
-
5-year earnings per share (EPS) growth: This metric reflects actual profit growth, supporting dividend sustainability.
-
5-year dividend growth: A company
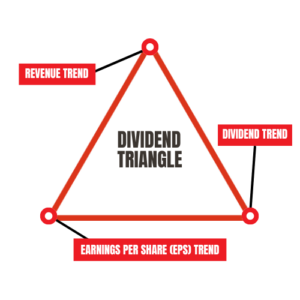
Dividend triangle represented as an image. committed to increasing its dividend year after year is typically one that has been well-run and built to last.
This is what I call the Dividend Triangle.
Even setting the bar at just 1%+ will eliminate companies that don’t align with your goals, without missing the great ones.
Step 3: Narrow by Sector, Not FOMO
You don’t need to buy a stock in every sector. But you do need some diversification.
-
Stick to the sectors you understand. If you’ve worked in finance, you’ll likely grasp bank reports more easily than biotech earnings.
-
Start with the underrepresented areas in your portfolio. This helps you reduce concentration risk and avoid duplicate holdings.
-
Pick 5–6 companies per sector at most, based on dividend triangle strength. That’s enough to find leaders without becoming overwhelmed.
Sector filtering keeps your research focused and manageable—and cuts out the hype.
Not Sure What to Do Next?
You’re not the only one. A lot of investors hit a wall after picking a few filters or bookmarking 10 stocks they’ll “get to later.”
That’s why we built the DSR Investment Roadmap—a clear, no-fluff guide to go from cash on the sidelines to a portfolio you actually believe in.
✅ Build your strategy
✅ Apply filters that work
✅ Skip the guesswork
✅ Invest with confidence
👉 Grab the Complete Roadmap—it’s free, and it actually works.
Step 4: Analyze What Really Matters
This is where most DIY investors get stuck: they try to read everything and drown in spreadsheets. Don’t do that.
Focus on these key areas:
-
The business model – How does the company make money? What keeps the engine running? If you can’t explain it in plain English, skip it.
-
The risks – Look for red flags: debt-heavy strategies, single-product dependency, regulatory risks, or volatile earnings.
-
The dividend track record – Not just the payout amount, but whether it’s been growing consistently and sustainably.
-
Red flags – Rising debt, declining margins, or erratic dividend increases all need a closer look before buying.
You don’t need perfection—just a repeatable process you trust.
Step 5: Test with a Mock Portfolio
Before you click “Buy,” try this: build a mock portfolio with your top picks.
-
Check your sector weightings to make sure you’re not too concentrated in one area (hello, 8 banks and 3 utilities).
-
Confirm your diversification across industries, dividend profiles, and growth potential.
-
Spot any overweight positions or gaps so you can rebalance before you’ve even spent a dollar.
It’s like test-driving your portfolio—and saves you from costly corrections down the road.
Step 6: Invest with Confidence (Lump Sum or Not)
Worried about buying right before a crash? That fear keeps too many people on the sidelines for too long.
Here’s what works:
-
All in, right now – This strategy is backed by decades of market data. Time in the market beats timing the market almost every time.
-
The 1/3 strategy – Invest a third now, a third in three months, and the last third three months later. Review quarterly results between buys.
This phased approach gives you a plan, reduces stress, and helps you move forward—without second-guessing every step.
Want the Full Roadmap?
This is just the summary version.

The full DSR Investment Roadmap includes:
✅ Ground rules templates to define your strategy and stock count
✅ Stock screener filters that actually work
✅ Sector-by-sector research tips so you don’t waste time
✅ Stock analysis breakdowns for consistent decision-making
✅ Position sizing guidelines to balance growth and risk
✅ Portfolio builder worksheet to test before you invest
🎯 Whether you’re starting from scratch or cleaning up a messy portfolio, this is the framework to help you build something strong, clear, and personalized.
👉 Download the free roadmap here » and take your first confident step today.
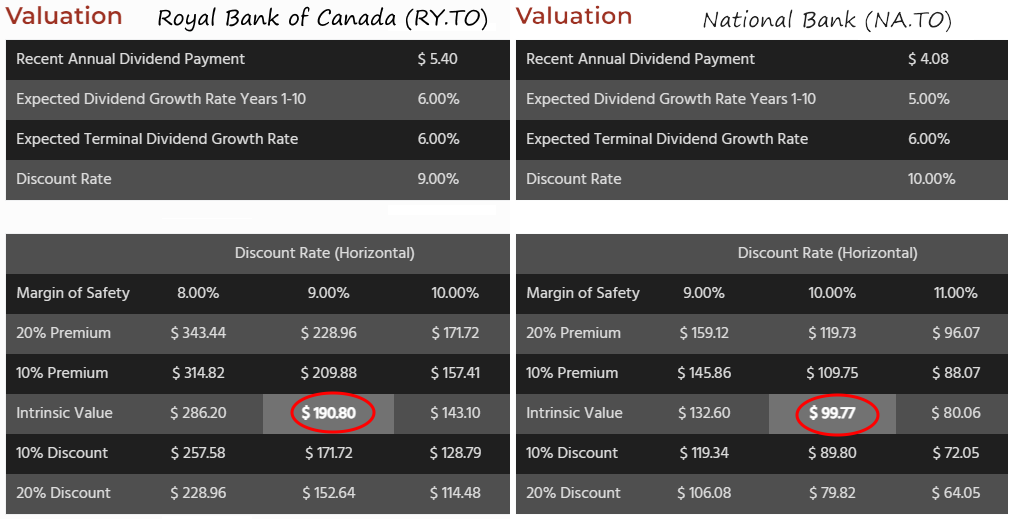
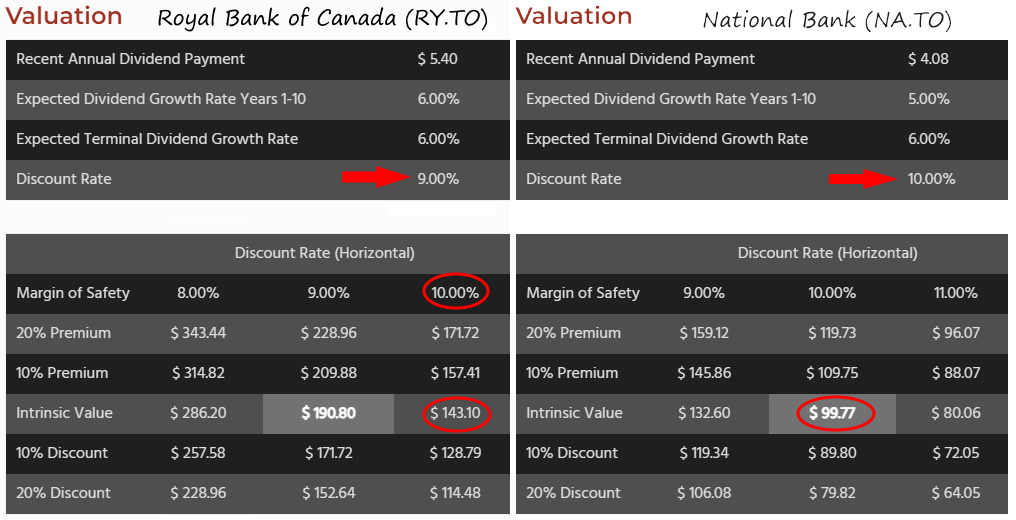
 I don’t use valuation to determine if the company is undervalued or not because, to be honest, your guess is as good as mine. If you put ten financial analysts in a room and ask them to determine the valuation of a company, you’ll likely end up with ten materially different answers.