One of the most debated topics among investors is how to assess the value of a stock. I like to use stock valuation models like the Dividend Discount Model (DDM) to compare similar stocks I have already thoroughly analyzed and find interesting, to see which one might be the best deal.
 I don’t use valuation to determine if the company is undervalued or not because, to be honest, your guess is as good as mine. If you put ten financial analysts in a room and ask them to determine the valuation of a company, you’ll likely end up with ten materially different answers.
They’re all smart folks, but each of them has a different perspective. However, using a valuation tool with the same perspective and applying it to two or more companies in the same sector makes it easier to identify which one is the best deal and the best fit with my investment thesis.
To clarify this process, let’s compare two Canadian banks: Royal Bank (RY.TO) and National Bank (NA.TO).
Analyzing RY.TO and NA.TO
Before looking at the fair value of Royal Bank and National Bank as per the DDM, any investor interested in them should analyze both; study their business model, look at their dividend triangle, evaluate the safety and growth potential of their dividend, identify their growth vectors and their risks. For details about what I do to analyze stocks, read this article.
Our diligent investor might summarize the analysis like this:
Business model:

- Both RY and NA are regulated and diversified Canadian banks
- RY is much larger than NA ($181B market cap vs. $35B)
- RY is more distributed geographically than NA, which is heavily concentrated in Quebec
Dividend triangle, dividend safety and growth:
- Both banks have a strong dividend triangle showing growth in revenue, EPS, and dividend
- NA shows slightly faster dividend growth since early 2022 and higher growth numbers over 5 years for all three metrics
- Dividend payout ratios are under control for both, with RY near 45% and NA near 37%
Growth vectors:
- RY has diversified revenue streams and is increasing its activities outside Canada
- RY targets growth in wealth management, capital markets, and insurance, with this trio already representing over 50% of its revenue
- NA follows a growth by acquisition strategy, targets wealth management and capital markets
- NA is more flexible and quicker to move due to its smaller size
Risks:
- RY capital markets and insurance growth vectors are inclined to variable returns
- RY has high exposure to Canadian housing market and the effects of rising mortgage rates
- NA is dependent on the Quebec economy, although it has been expanding with private banking in western Canada and investments in emerging markets, such as the ABA bank in Cambodia
- NA takes more risks to find growth vectors

DOWNLOAD THE LIST HERE
With all this analysis information on hand, our investor still hesitates between Royal Bank and National Bank and now turns to the DDM valuation to compare them.
Comparing NA.TO and RY.TO Valuation
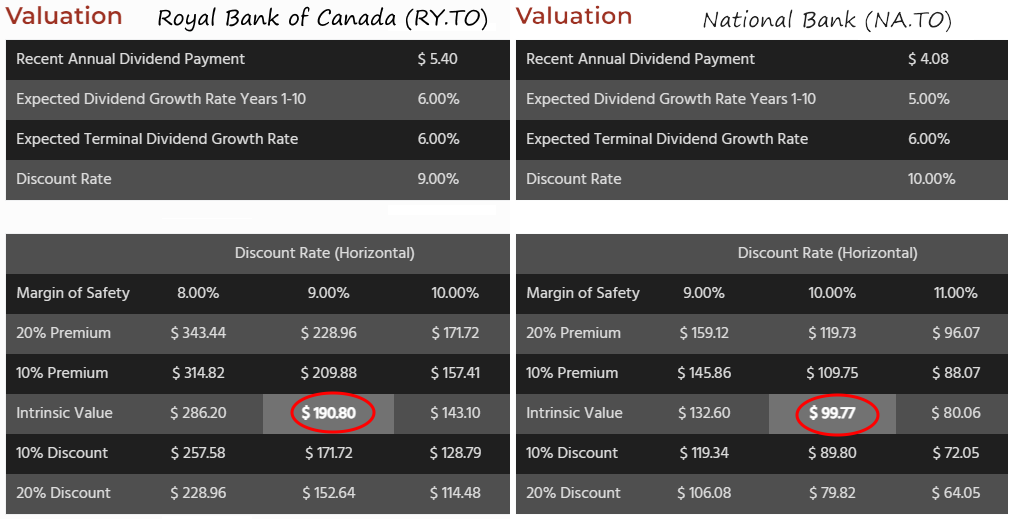
Here is the DDM valuation data for both Royal Bank and National Bank taken from their respective stock cards on the DSR website.

At the time of writing, National Bank was trading at about $103 per share and Royal Bank at around $131.00 per share.
Looking at this data to compare both banks, including the value circled in red for each bank, observe the following:
| RY | NA | |
| DDM Intrinsic value | $190.80 | $99.77 |
| Current stock price | $131 | $103 |
| Stock currently trading at | 45% discount | 3% over its value |
At 45% discount, RY looks like an amazing deal, a slam dunk, right? It certainly does, but…there is a crucial difference to understand here, which is the discount rate. The discount rate, also known as the “expected return”, represents the minimum acceptable rate of return that an investor expects to earn on their investment to compensate for the risk and opportunity cost of investing in that particular stock.
Compare Apples to Apples
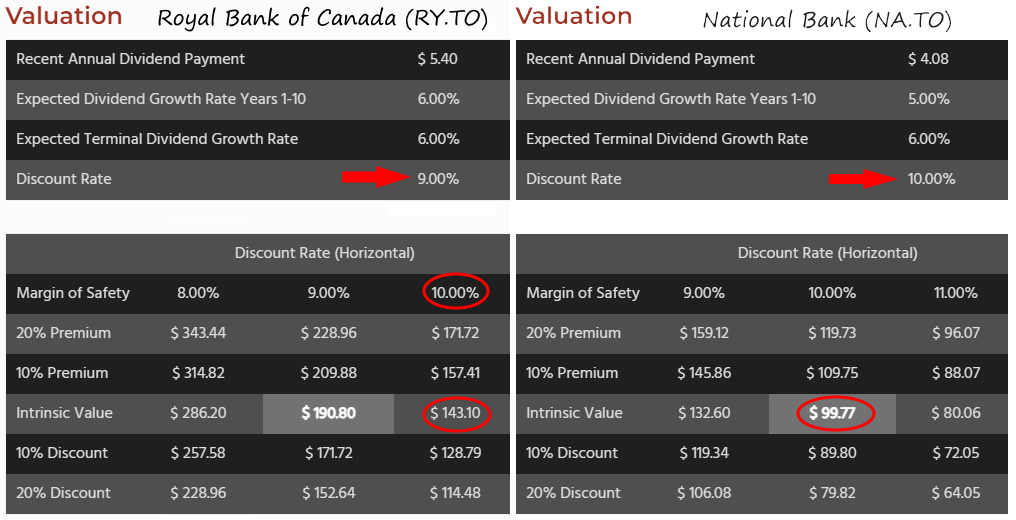
Notice below that the discount rates used for the intrinsic value of RY and NA are not the same. Due to RY’s geographic distribution and revenue stream diversification mentioned earlier, we used a discount rate of 9%, whereas NA’s more audacious approach made us use a 10% rate.

If we compare both banks with the same discount rate of 10%, we see that the difference between the two is significantly reduced.
| RY | NA | |
| DDM Intrinsic value | $143.10 | $99.77 |
| Current stock price | $131 | $103 |
| Stock currently trading at | 9% discount | 3% over its value |
If you hesitate between RY and NA, a look at the DDM value confirms that your dilemma is between two really good stocks. RY might seem a better deal at current prices, but NA could be a better pick if you want more growth potential and are prepared to live with more volatility in the stock price.
I have both Royal Bank and National Bank in my portfolio because both fit my investment thesis. I appreciate National Bank’s significant growth potential and Royal Bank’s more stable and steady approach. As a reliable source of income that also shows growth vectors, RY.TO is also included in the DSR Canadian retirement portfolio model.
