• Skip to main content

MOOSE MARKETS

INVESTING THE CANADIAN WAY

  • Dividend Investing
    • Best Canadian Stocks to Buy in 2025
    • Dogs of the TSX – Beat The TSX! 2025
    • Canoe Income Fund
    • Canadian Banks Ranking 2025
    • Canadian Dividend Rock Stars List
    • Canadian Dividend Aristocrats 2025
    • Buy and Hold Forever Stocks
  • REITs
    • Canadian REITs Beginner’s Guide
    • Best Monthly REITs 2025
  • How To
    • Income Products at Retirement
    • 4 Budgets of Retirement
    • Create a Cash Wedge at Retirement
    • 5 Questions for a Confident Retirement
  • ETFs
    • Guide to ETF Investing
  • Portfolio Strategies
    • Canadian Depositary Receipts (CDRs)
    • Building an Income Portfolio – Made Easy
  • Newsletter
  • Podcast

Mike

Dividend ETFs, Are They Worth it?

How about dividend ETFs? I’ve been asked this question often during webinars. ETFs are useful due to their offering the investor immediate diversification along with minimal fees. To be honest, it’s the perfect solution for anyone who doesn’t want to put the time and energy into managing their portfolio and selecting their stocks.

However, in most cases, this also means you are likely to be leaving money on the table. Dividend ETFs could be too diversified. Having over 100 dividend stocks may hurt total return. I found out that investing in a small number of stocks brings better results.

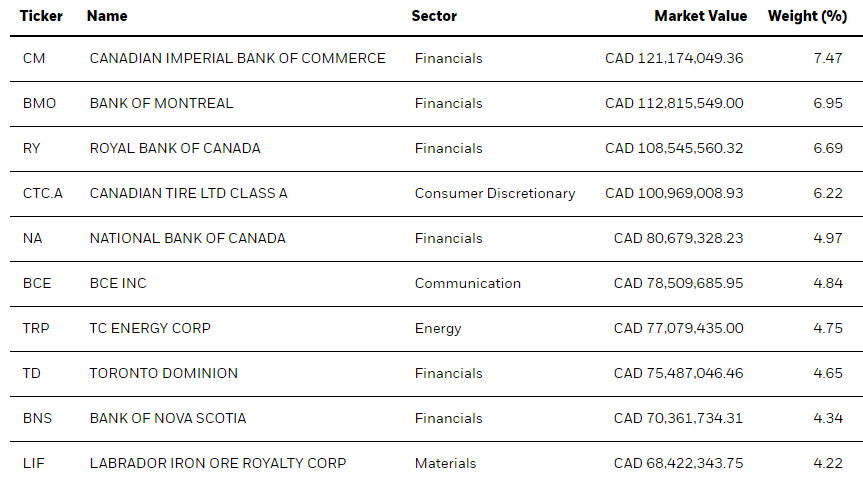
I haven’t yet found a dividend ETF that shows only companies that I would like to invest in. If I look at the top holdings for XDV.TO for example, its largest holding is CIBC (CM.TO). While Canadian banks are great, CIBC ranks #5 in my Canadian Banks Ranking. The other thing I dislike is that they count all 6 banks in their top 10, which may lead one to believe they haven’t heard of the concept of diversification.

Canadian dividend ETF holdings

source: BlackRock iShares Canadian Select Dividend Index ETF

To get back to the question: are dividend-paying ETFs worth it? If you don’t have the time, knowledge or interest to manage your portfolio, ETFs could be a good strategy. Selecting individual stocks will help you reach your goals faster and stay closer to your investing values.

However, that doesn’t mean ETFs can’t coexist with individual stocks in your portfolio.

What Could be Really Worth it?

I can see several reasons why an investor would consider ETF investing. Here are a few good examples.

Benchmark

Since the beginning of DSR, we have been using VIG and XDV.TO as our benchmarks. The point of using benchmarking is to assess our strategy vs. an existing alternative solution. Why would I spend time managing my portfolio if I could quickly buy an ETF and make the same money? It only makes sense if I can do better than existing investing solutions.

The problem with benchmarking is we often become too focused on short term results. One must know that looking at any performance records under three years is pure noise. It starts to be meaningful after five years and is very meaningful once you have gone through a full economic cycle.

Start investing

Many asked me how I started my RESP, the account used in Canada to pay for childrens’ college tuitions. I started this account a long time ago with just a couple of hundred dollars. It was not enough to build a portfolio and the monthly systematic investment plan would add a lot of complexity if I had to pick a different stock each time. Therefore, for the first few years, I invested all that money in ETFs until I built a value above $10,000. I then switched this portfolio to the DSR investing methodology focusing on dividend growers.

As a first step in the investment world, ETFs will provide you professional support (ETFs are built and managed by experienced industry professionals), instant diversification (invest in 50-100 securities with a single trade), and peace of mind (no need to manage the ETFs composition). Therefore, it’s the perfect vehicle to use to start a new portfolio.  I’m currently showing this same strategy to my two teenagers (and soon to my 10yr old son).

Diversification

While I wouldn’t use ETFs to replace any of my individual stocks, you might improve your portfolio diversification by using them for other asset classes. You can invest in fixed income products such as bonds and preferred shares (we have over 80 bond ETFs and 18 preferred share ETFs in our screener). You could also invest in commodities, emerging markets, or cryptocurrencies through ETFs.

Searching by theme using the search box of our screener, you can rapidly find viable options to add to your portfolio. This additional diversification may help to reduce volatility (bonds / preferred shares), protect your portfolio against inflation (commodities) or hopefully improve the upside potential. Those assets won’t necessarily generate dividends, but they can bring something else to your portfolio.

Exposure to a sector without the work

It could also be a good strategy if you want to gain exposure to a specific industry that you don’t fully grasp. I’ve expressed my interest for the technology sector in the past. Some investors may be intimidated by new technologies and wouldn’t be comfortable analysing growth opportunities in this sector. Some others might have a hard time understanding big pharma’s pipeline development and patents while others might be lost trying to understand how life insurance companies work. Many times, Canadian investors have told me they were good at selecting Canadian stocks but would rather use ETFs to gain exposure to the U.S. markets.

If you aren’t comfortable with investing in a specific sector or market, you can use ETFs. You would benefit from an ETFs best quality (diversified, cheap and professionally managed).

Build a core portfolio

Finally, ETFs could be a good tool to build a core portfolio and then add some spice with individual stocks. Think of investing as cooking a good meal. You can use ETFs as your “core soup” while you make necessary adjustments with different spices by using individual stocks. A 50% ETF and 50% stock portfolio might bring you the peace of mind you may be looking for while you keep control of a good part of your money.

How to Select Your ETFS

As is the case with any investment products, ETFs may track the same asset or follow the same investing strategy, but they are not created equal. There are a few things you must consider before making your decisions.

Financial metrics

In the DSR ETF screener, you will find a good list of metrics to analyze ETFs. The year to date, 1yr, 3yr and 5yr returns will tell you much about the performance of the ETF. It is then easier to know what to expect from this product and make comparisons.

The expense ratio is also very important since you can then pick the cheapest (and hopefully best performing) ETF for a specific sector. If you can’t decide between two similar ETFs, pick the one with the cheapest fees. It is likely the one that will have the best chance of performing well in the future.

Volume and assets under management (AUM) will tell you more about the liquidity and the size of the ETF. It’s important to invest in assets that are liquid. You also want to avoid the latest flavor of the month.

The historical spread will also give you an idea on the ETF’s volatility (the wider the spread, the higher volatility). This could have a big impact on price fluctuations during a market crisis.  We saw how some preferred shares and bond ETFs plummeted in March of 2020.

The discount/premium to NAV (net asset value) will tell you if you are paying more than what the ETF is worth or if you are getting a bargain. In general, you want this number to be as close to zero as possible in order to buy at the right price.

ETF analysis

While you can easily make your selection based on basic metrics, but if you want exposure to commodities, or bonds, you must perform a few additional checks if you want an ETF that includes equities.

Once you have selected a pack of ETF that might work with your portfolio, you still have some work to do. The ETF analysis must include the comprehension of the investment strategy. You can usually find this information from the ETF manufacturer (the financial firm managing and selling the ETF). Here’s an example from VIG:

“The investment seeks to track the performance of the S&P U.S. Dividend Growers Index that measures the investment return of common stocks of companies that have a record of increasing dividends over time. The adviser employs an indexing investment approach designed to track the performance of the index, which consists of common stocks of companies that have a record of increasing dividends over time. The adviser attempts to replicate the target index by investing all, or substantially all, of its assets in the stocks that make up the index, holding each stock in approximately the same proportion as its weighting in the index.”

Some are obviously more complicated or opaque than others. Here’s ZWB.TO, a covered call ETF:

“BMO Covered Call Canadian Banks ETF seeks to provide exposure to the performance of a portfolio of Canadian banks to generate income and to provide long-term capital appreciation while mitigating downside risk through the use of covered call options.”

You know they will use covered call options. Unfortunately, you won’t know much about how their option writing process works with this information. If you are curious, you can also read more in the ETF prospectus also found on the company’s ETF website.

The second step is to check the ETF’s top holdings. It will quickly determine if this ETF could fit in my portfolio or not. By looking at the top 10 holdings, you will see what drives this investment. If you cringe on one or two company names, you might want to skip this one and select an alternative ETF.

The third step will require you to look at the ETF sector allocation. At DSR, we are currently able to give you the ETF sector if it’s a single sector ETF, but we can’t ventilate several sectors. To do that, you must go to the ETF’s website and look at the graph provided by the financial firm. Looking at how the ETF is invested throughout various sectors will allow you to better predict the impact on your portfolio’s volatility and upside/downside potential. This extra step requires more calculations, but it is crucial for you to include your ETFs allocation in your portfolio.

Finally, I wouldn’t over complicate things when it comes down to ETF investing. ETFs have been created to be efficient and simple to understand. Once you have selected the asset exposure you desire, look at a few financial metrics. Then, confirm your choice by looking at what’s inside the hood. Don’t attempt to track each ETF movement and change in allocation. You may spend as much time as you would have if you selected individual stocks. The power of ETF investing resides in the simplification of your strategy. Therefore, adding a dozen ETFs doesn’t necessarily improves your portfolio quality or simplicity.

Warning: Canadian Dividend ETFs’ Dividends Aren’t Stable

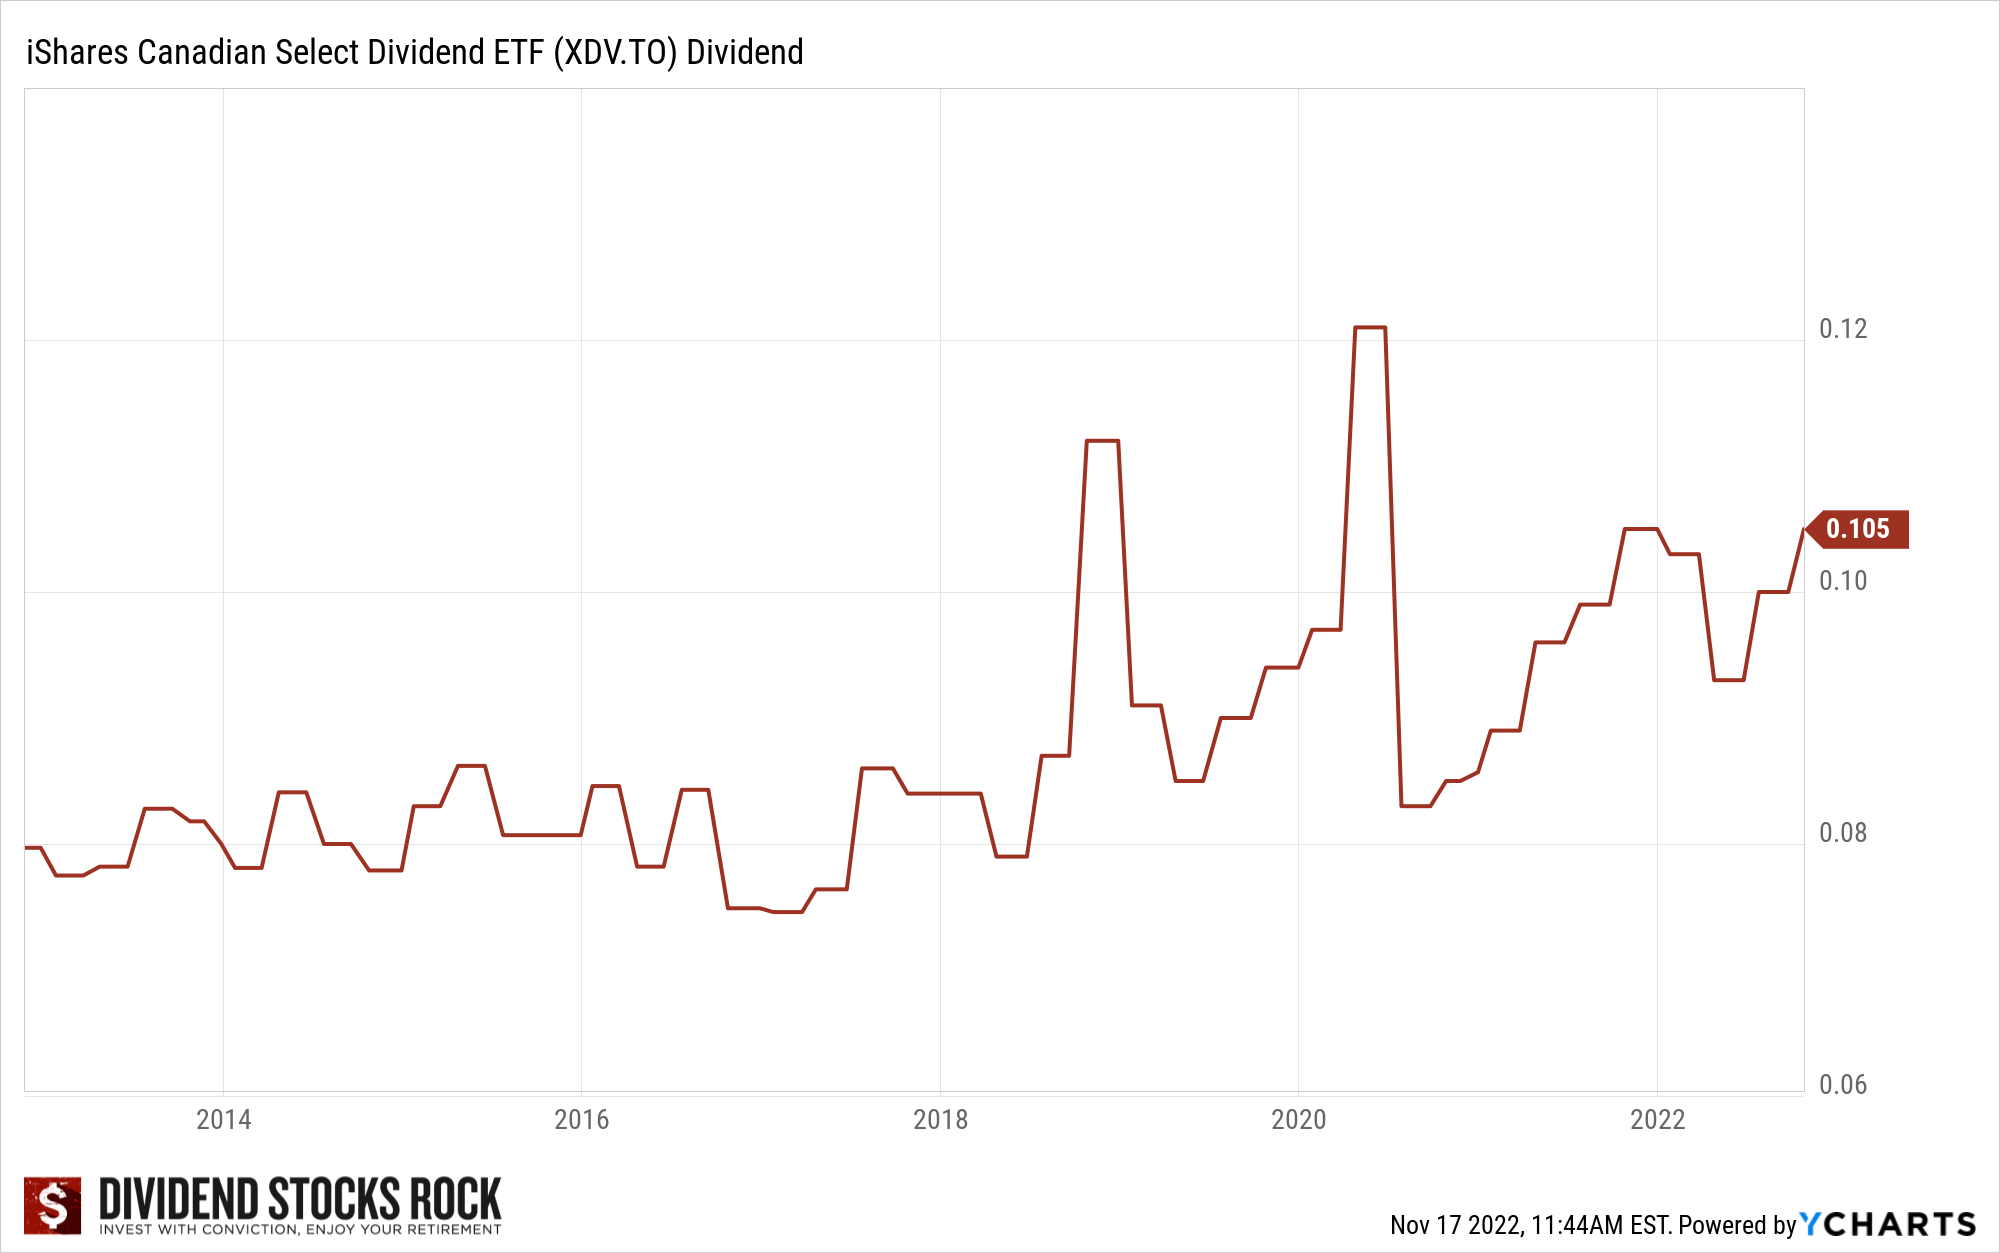
You read right: dividend ETFs don’t pay a stable dividend. It creates lots of confusion and frustration among investors! Let’s take a look at how the iShares Canadian Select Dividend ETF (XDV.TO) rewarded its investors.

ETF dividends

Dividend ETFs will receive dividends from the company they invest in. They may also reward investors with additional distributions generated by capital gains or other profits generated by the liquidity or other investment vehicles inside the ETFs.

As you can see in the previous graph, the dividend eventually goes up. Unfortunately,  it will not be steady from quarter to quarter.

Final Thought

I am not considering investing in ETFs any time soon. However, I consider this product to be a great tool for investors. The fact that you can quickly diversify your portfolio at a ridiculously low price makes ETFs an investors friend. It’s the perfect fit if you want to invest in a sector but don’t want to do the extra research attached to stock picking.

If you are happy with individual stocks like I am, please do not feel the need to add ETFs to your portfolio. If your strategy is working already, there is no need to fix something that is not broken.

Smith Manoeuvre – A Tax Deductible Mortgage Strategy

The Smith Manoeuvre is a Canadian strategy that is designed to structure your mortgage so that it is tax deductible.

Since the Real Estate market has gone up in value significantly over the past few years, I’ve decided to use some of that equity sleeping in my house to invest in the stock market.

For Canadians, this means I’m doing the Smith Maneuver (transforming the interest paid on my mortgage into a tax-deductible expense). For all other investors, this article will talk about leverage in general. Should you borrow to invest? What’s the possible outcome? What are the risks? How to start investing with borrowed money? These are the subjects we will discuss today!

Why do a Smith Manoeuvre?

First things first, the Smith Manoeuvre includes leverage. This means borrowing money to invest. This is not for everyone (more on that later), please do your due diligence and make sure you have the right risk profile before using leverage.

All right, now that we have the disclaimer out of the way, here’s some background information from yours truly. In 2003, I completed my bachelor’s degree with a double major (finance & marketing). I started a job at National bank in the credit department for partnerships with Power Corporation. My goal was to help financial advisors build credit applications for their clients who wished to use leverage to provide capital for investments. In other words, I was the architect behind millions of dollars of investment loans.

I also used the Smith Manoeuvre for several years back then with great success. I saw the best and the worst of this strategy throughout those five years. I’ve seen investors build enormous wealth and others have burned down tens of thousands of dollars on a margin call. I can’t stress this enough; leverage can bring the best out of the stock market and can also destroy your wealth. Please use this strategy with caution.

Wealth generation

Why did I decide to use such a “dangerous” strategy? Because I have time, knowledge and an incredibly high-risk tolerance on my side. The math behind leverage is quite simple. If you can borrow money at a 3-4% interest rate and then invest it at a 6-7% return, you can create wealth out of thin air.

With conservative numbers and $333.33 per month ($4,000 / 12), you can create more than half a million dollars in 30 years.

Imagine borrowing $100K at 4% for the next 30 years. The cost out of pocket would be $4,000 per year, or $120,000 for the entire duration of this loan. Keep in mind that the $4,000 doesn’t move (unless your interest rate changes). This means that $4,000 in 20-30 years from now isn’t that much if you factor inflation.

Now if you take that $100K loan and you invest it at a 6.5% average annual return, 30 years later your investment would have grown to $661K. You could then pay off your loan and end-up with more than half a million dollars. Over 30 years, you turned $120K into $561K (more than 4.5 times your investment). With leverage, the advantage is that you turned a 6.5% return into 9.1% (you must achieve a 9.1% investment return on a yearly investment of $4,000 to reach $566K in 30 years.

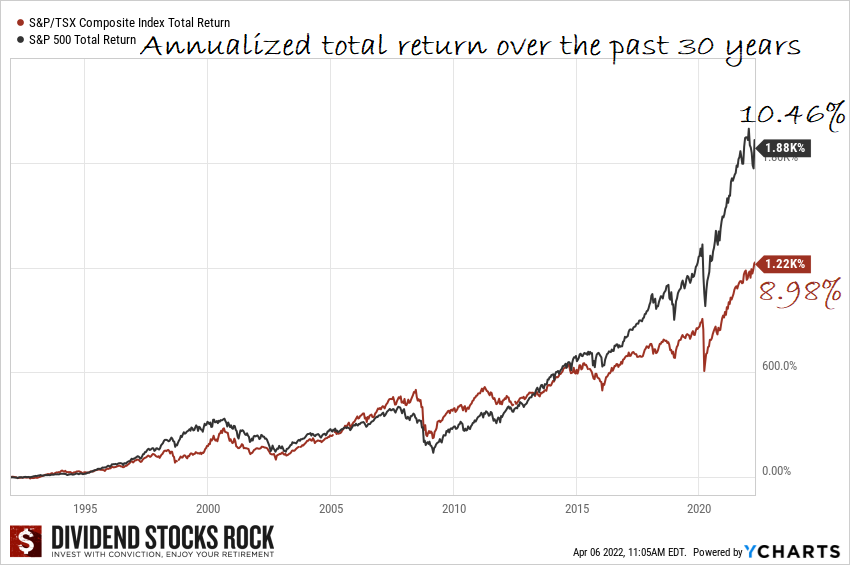
Using a 6.5% expected return is quite conservative (see the chart of the S&P 500 and the TSX on the following page). I could potentially talk about 8.5% return and how you could transform the same $120K in interest payment into more than $1M net of debt.

But that’s daydreaming and you must also consider taxes applicable to this strategy. Now that you understand the wealth generation ability, let’s talk a little bit more about the dangers inherent in this strategy.

S&P 500 and TSX total return

The danger of leverage – This is not for everyone

While I used conservative numbers (a 100% equity position should generate an annualized return of 6.5% over a 30-year period), this is still a positive scenario. If you borrow $100K today and your investment goes down by 30%, you then have $70K invested and you are still paying interest on a debt of $100K. You could also get sick or need additional money for many reasons. These perspectives are enough to make a lot of investors sick. At best, leverage should be a complement, not a “all-in” strategy. It could turn even worse if you have a margin call.

If you use your investment as collateral, there is a good chance that the bank will set a minimum value for your portfolio to maintain the loan. When your portfolio goes down too low too fast, the bank will “call you” and ask you to put more money in the portfolio. If you don’t have liquid assets, the bank would simply sell your investments and use the proceeds to cover the loan (or a part of it).

Because I want to slowly build my leveraged portfolio and I don’t want to get squeezed by a margin call, I’ve decided to use my house as collateral for my leverage strategy. Here comes the Smith Manoeuvre!

What’s the Smith Manoeuvre?

The Smith Manoeuvre is a Canadian strategy that is designed to structure your mortgage so that it is tax deductible. A financial planner named Fraser Smith introduced this concept where you borrow money against the equity in your home, invest it in income-producing entities (dividend paying stocks), and use the tax return to further pay down the mortgage. It’s not that impressive for our fellow Americans since their mortgage interest is already tax deductible. But it’s a big thing for Canadians since we don’t have this advantage!

To set this strategy up, you need a home equity line of credit (a source of revolving credit). Then, each month, you pay off a part of your mortgage (imagine $500 in capital). Right after you pay off that capital on your debt, you use the home equity line of credit (HELOC) and borrow that same $500 and invest it.

Month Mortgage HELOC Interest paid Investment Account Net Wealth Creation
0 (start) -$200,000 $0 $0 $0 0
1 -$199,500 -$500 $1.66 $502.70 $1.04
12 -$194,000 -$6,000 $130.04 $6,215.50 $85.46
360 -$20,000 $180,000 $108,300 $556,084 $267,784


Following this chart, I could transform $180K of debt into a tax-deductible mortgage by simply using $500 a month for my leverage strategy. You could go a lot faster by increasing the amounts. Obviously, if you boost the amount invested or increase the percentage of expected return, the strategy looks even more attractive.

The largest advantage of leverage (on top of the tax deductibility) is the power of compounding interest. While the interest you pay monthly doesn’t compound, the amount invested is compounding. Throughout time, a small difference of 2.5% (4% interest vs 6.5% investment return) creates thousands of dollars even if you start small.

All about long-term

The point here isn’t to make you dream about riches, but rather to show you how even a conservative leverage strategy could create incremental wealth. The plan I’m about to discuss applies to the start of my Smith Manoeuvre (with $500 a month) but could be applied to a larger leverage amount either using a monthly investment or a lump sum payment.

Keep in mind that the basic rules of leverage will apply on a $500 or a $500,000 loan. The way you build your portfolio and how you should approach this strategy remains the same. Numbers are just growing with zeroes, but they react the same to the power of compounding interest.

In the next two parts of this article, I’ll share with you my plan and the portfolio model I wish to build in the coming years. I will show you how to use DSR tools to build your own leverage strategy.

The Smith Manoeuvre Plan

The purpose of this exercise isn’t to make you follow my plan and invest the same way. I want to provide you with a guideline as I am building this wealth creation strategy. As I successfully built my pension portfolio using exclusively Dividend Stocks Rock tools, I’m doing the same thing for the Smith Manoeuvre portfolio. Numbers and details could change depending on your financial situation, your age, and your risk tolerance. Again, do your own due diligence.

Opening a margin account allows options

First things first, which type of account should you use to invest using leverage? Since I’m a bit crazy, I’ll be opening a non-registered margin account. To make your leverage strategy successful, having a non-registered (meaning a taxable account) is mandatory. One of the perks of leveraging is to be able to use the interest you paid on your loan against the investment income you generated. Therefore, using the 4% interest rate and the 6.5% expected returns numbers, the first 4% return of the portfolio is “tax free”.

Margin account

Opening a margin account instead of a regular non-registered account is to give me additional flexibility. My goal isn’t to use margin on top of borrowing money. That’s what we could call a “double-dip”. However, if the market drops drastically, I’d like to have additional liquidity ready to be deployed. Imagine if my pension plan was in a margin account during March of 2020. I could have easily borrowed $50K and boosted my positions into amazing companies like Canadian Banks, Telcos, Utilities and Tech stocks.

My margin account also allows me to trade options. Since the goal of this portfolio is to generate investment income, I would also leave the door open to writing covered calls in the future. This would obviously not happen right away, but I would rather be set with the most flexible investment account upfront. Then, I don’t have to worry about any other paperwork.

Setting a budget

Once I decided to open a margin account allowing option trading, it was time to determine how much money I wanted to borrow each month (or a lumpsum amount if you have lots of equity sleeping in your house). Keep in mind that leveraging should be a complement to your wealth generation plan. Your financial plan should not rely solely on leverage.

The reality of a business owner is that there are always a thousand things going on in my financial life. Therefore, I don’t want to go “all-in” with my Smith Manoeuvre for now. For this reason, I thought of starting with $500 per month. This enables me to keep my financial flexibility (and continue to support my children as they go to college!). I will revisit this amount separately each year.

If you intend to use a larger amount for your leverage strategy, I’d suggest you consider two things. First, the amount of interest that must be paid monthly on that loan. It’s fun to imagine the compounding interest on a $250,000 investment over the next 20 years, but this requires cash flow in the meantime. At $250K, we are talking about a very nice car payment $833.33/month at 4%. To make sure the leverage strategy works, the most important thing is to have time. Therefore, you must ask yourself if you can afford a “BMW payment” for the next 20 years or so.

Investment rules

As you know already, I like to keep things simple. There is no need to have a complex investing strategy because you have borrowed money to invest. However, there are a few more rules to observe for this specific approach.

#1 Follow the DividendStocksRock methodology

When you borrow to invest, you want to reach a balance between generating an interesting total return and making sure you don’t put your portfolio at risk. Taking “bets” would end-up badly in a leveraged portfolio while focusing on dividend growers will achieve this balance. The DSR methodology to pick stocks will apply perfectly to this strategy (but I’ll add rule #4 in my stock selection process).

#2 Invest for the long term (minimum 20 years)

I’m currently 40 and I plan to use this strategy for the next 30-40 years. Since it’s a compliment to my wealth generation plan, I will be able to keep my leverage strategy above 70. The idea with leverage is to use compounding interest to your advantage. You can only do that over a long period of time.

#3 Invest 100% in Canadian stocks

I’m not your tax guy, but if you are Canadian and you want to play around taxes, it would be a good thing to invest in Canadian stocks to benefit from the preferential Canadian dividend tax treatment. Only Canadian corporations will pay eligible dividends. Therefore, I’ll keep my love for U.S. dividend growers in my tax-sheltered pension (LIRA) and retirement (RRSP) accounts exclusively.

#4 Generate a minimum yield of 5.5%

Right now, my HELOC interest rate is set at 5.4%. Therefore, my portfolio must generate at least 5.5% in dividend income. Again, I’m not your tax guy, but if you are Canadian and you wish to deduct the interest you pay against your investment income, it can’t be used against capital gains (e.g., it must be interest or dividend income). Then again, it doesn’t mean that all stocks in your portfolio will offer a 5% yield and above, but the total generated by the portfolio must be in that range.


Smith Manoeuvre Execution – Portfolio Model

To select the companies “worthy” of my leveraged portfolio, I will get inspiration from the Canadian Retirement portfolio and the 100% Canadian portfolio models. I’m looking at stocks offering a decent yield (minimum of 3%) but with some growth opportunities as well. I used the DSR stock screener, the watch list (PRO feature) and the portfolio builder (PRO feature) to build my portfolio model. If you can’t use the DSR stock screener, you can look at the Dividend Rock Stars List here.

Stock selection using DSR stock screener

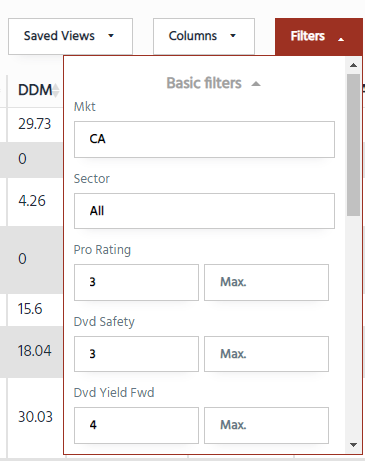
stock screener smith manoeuvreThe first step in finding interesting stocks is to go to the Canadian Retirement portfolio and the 100% Canadian portfolio models’ pages and select companies with a minimum rating of 3 for both the DSR PRO rating and the Dividend Safety Score. I also added a minimum dividend yield of 4% as I want to make sure I can use the full 5%+ interest rate that will be charged on my loan by the end of the year. Right now, I’m at 5.4% on a variable rate. That helped me to select a few stocks, but it wasn’t enough to build a complete portfolio. I wanted to double-check across our entire stock library.
Then I used the same filter with the stock screener. I don’t want to start too narrow. This simple set of filters gave me a list of 75 companies. To build a diversified portfolio, I’d like to have about 20 stocks. The plan is to buy one position each month over the course of almost two years. Having to investigate 75 stocks upfront seems a bit overwhelming.

So, here’s my trick: I kept the filters in place and looked at each sector one by one. After all, there is no point in looking into 10 stocks in the same sector. If this happens, I can always add more minimum metrics or select stocks with a rating of 4 for the PRO rating or the Dividend Safety Score.

I then selected my favorite 3-4 companies per sector to see how many companies I could rack up. Between both techniques, I got to a short list of 22 stocks that might make a good fit for my portfolio.

Deep dive with the watch list

Before I started my research with the stock screener, I emptied my watch list. The watch list enables you to see only the stocks you have selected in the screener. This is great to create a group of companies you like and want to follow going forward.

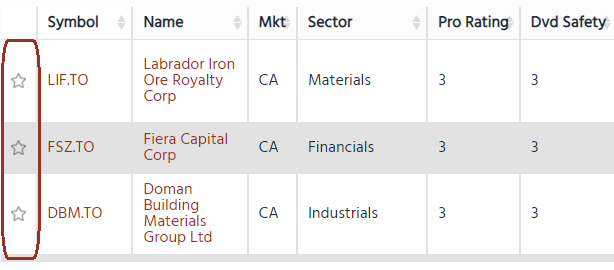
I selected each stock that looks interesting by clicking on the star button on the left side of the stock screener. Those selections are then automatically reported to the watch list.

Why would I bother to add all those stocks to a watch list? For two reasons:

#1 I will invest in new companies each month for a long time. I want to keep a close eye on my prospects.

#2 I can then look at my favorite stocks and download the excel spreadsheet with all data

While I love our stock screener, when you look at 30 financial metrics, it’s not that easy to see them and sort them as you want. Excel is a better software to use to make an additional triage among the list of your potential stocks. Then, I can read each stock card and start building my portfolio! Will I go ahead and buy the 22 stocks? Let’s build a fake portfolio to see what it looks like, shall we?

Sector allocation verification with the portfolio builder

The last thing to do before pressing the buy button is to check to see if the portfolio makes sense. I won’t have to make ~20 buy decisions today, but it helps to have an idea of where I’m going with my purchases. Therefore, I’ve built a fake portfolio using the portfolio builder. Good news: in a few months, you’ll be able to select which portfolio you want in your consolidated reports. You will select which portfolio(s) you want and generate as many reports as you wish!

Here’s the list of all the potential stocks after the review:

Symbol Name Sector Pro Rating Dvd Safety Dvd Yield Fwd
AP.UN.TO Allied Properties REIT Real Estate 4 3 6.74%
AQN.TO Algonquin Power & Utilities Utilities 4 4 6.81%
ARE.TO Aecon Group Industrials 4 3 7.72%
AW.UN.TO A and W Revenue Royalties Income Fund Consumer Discretionary 4 3 5.63%
BEP.UN.TO Brookfield Renewable Utilities 4 4 4.34%
BEPC.TO Brookfield Renewable Utilities 4 4 4.14%
BIP.UN.TO Brookfield Infrastructure Utilities 4 4 4.04%
BMO.TO bmo Financials 4 4 4.35%
BNS.TO ScotiaBank Financials 4 4 6.22%
CM.TO CIBC Financials 4 4 5.31%
CNQ.TO Canadian Natural Resources Energy 4 4 4.12%
CRT.UN.TO CT REIT Real Estate 4 3 5.44%
EIF.TO Exchange Income Industrials 4 3 5.47%
EMA.TO Emera Inc Utilities 4 3 5.63%
ENB.TO Enbridge Inc Energy 4 3 6.39%
FTS.TO Fortis Inc Utilities 4 4 4.30%
GRT.UN.TO Granite REIT Real Estate 4 4 4.13%
GWO.TO Great-West Lifeco Financials 4 4 6.48%
KMP.UN.TO Killam Apartment REIT Real Estate 4 3 4.28%
NET.UN.V Canadian Net REIT Real Estate 4 4 5.50%
PKI.TO Parkland Corp Energy 4 3 5.12%
POW.TO Power Corp. Financials 4 4 5.98%
SYZ.TO Sylogist Information Technology 4 3 8.74%
T.TO Telus Communication Services 4 4 4.92%
TD.TO TD Bank Financials 5 4 4.03%
TPZ.TO Topaz Energy Energy 4 4 5.13%
TRP.TO TC Energy Energy 4 3 5.99%

I’m not saying this will be my final portfolio. However, it’s a great start and it gives me a very strong buying list to look at. Each month, I’ll go deeper in a specific stock and adjust along the way. Remember, investing is like hiking, you don’t get to the summit or get a great view during the first 100 meters.

Why Using Leverage? Should You Do It At Any Age?

I’d like to end this article on a very important topic; at what age leverage becomes irrelevant? I’ve highlighted the point of risk tolerance several times. If you can’t sleep when your portfolio is down 10%+ or because interest rates are rising, leverage isn’t for you. Not now, not at any age. Period.

As a banker, we used a few rules to qualify investors for an investment loan (on top of having a very high-risk tolerance). I’ve modified them a little:

Smith Manoeuvre Rules

#1 Don’t borrow too much. I believe the rule back then was to not borrow more than 50% of your liquid net worth (liquid = investments, no houses or rental property)

#2 Make sure you can afford to make the loan payment. The investment and growth parts are fun, but if you can’t pay the loan from your regular income, don’t go there. You don’t want to squeeze your budget with another loan.

#3 Invest for 20 years or go home. The rule was more to do it at least for 10 years, but it seems a bit short to my taste. The idea is to go through a full economic cycle (recession + expansion). If you can let your investments ride through several economic cycles, you will realize the full power of compounding interest. In other words, it comes down to: Don’t borrow what you cannot afford and let your investment run for a long time.

If you can withstand fluctuations (and you keep your eyes on the long-term horizon), using leverage before 50 is a very smart move. I’ve used leverage several times in the past and it paid off nicely. Using leverage for 20-40 years seems like a no brainer. But is it the case when you are 50 or even 65?

Should you use leverage at 50? Over 65?

Assuming your life expectancy is somewhere between 85 and 95, if you start a leverage operation at 50, this means you have a good 35 to 45 years to make it bloom. This should be enough to generate wealth for the next generation (and hopefully for your grandchildren too!). Therefore, it would make sense (assuming, again, that you have a high-risk tolerance).

Finally, The “last chance” to do a leverage operation is probably when you get close to 65-70. I really focus on that 20-year period to make sure the investment grows and blooms. I don’t think it would be useful to start leverage in your 70’s as it would likely bring on more stress than anything else. Again, some people want to generate additional wealth for generations to come and this strategy provides a vehicle for that incremental growth.

I hope this article has given you some food for thought. I’ll be covering my Smith Manoeuvre in my portfolio newsletter update going forward. You’ll be able to follow my progress.

From CAD to USD With No Fees – A Guide to Norbert’s Gambit

Norbert’s Gambit strategy is the most effective way to convert CAD to USD (Canadian Dollar to U.S. Dollar) or vice versa without paying expensive Canadian banks’ conversion fees. In this article, I’ll show you how I save ~2% on all my conversion fees with Norbert’s Gambit strategy. This currency conversion technique is:

#1 Risk-free, you don’t assume any costs or risk doing it.

#2 Easy to understand and easy to apply. You only need a few minutes and an online brokerage account.

#3 Working all the time. What you do with Norbert’s Gambit is that you cut the middleman. You just save fees you shouldn’t pay in the first place!

How to convert CAD to USD

You may want to convert some of your loonies into U.S. dollars for a trip to California or you think it’s better off to invest a part of your money in the U.S. market (and you are right doing so). In both cases, you will need to convert your CAD into USD at your bank or a currency exchange office.

Once you get to the counter, the agent will wrongly tell you there are no fees in converting money into another currency. The conversion fee is hidden in the rate you get. You don’t believe it? try this trick:

If you pull out your phone and Google “CAD to USD”, you will get a completely different rate than what you are offered at the counter.

CAD to USD rate

It’s only normal that your bank or the currency exchange agent offers you a conversion rate between 1.5% to 3% lower than the real one. This is how they make the transaction profitable for them.

Now I know you are frustrated because you just realize your banker kept money in his pocket each time you bought U.S. dollars (or worst, when you got hit twice if you converted back the money you didn’t use during your trip!). There is good news, someone found a way for you to save fees. His name is Norbert Schlenker.

What’s Norbert’s Gambit Strategy?

A financial advisor named Norbert Schlenker from Libra Investment Management, a B.C. investment firm found a solution for his clients. According to the online “legend”, this creative advisor established a strategy to skip the middleman and not pay conversion fees. Here’s how it works:

Some companies trade on both Canadian and U.S. stock markets. You can think of Canadian Banks for example. Therefore, if you purchase shares of Royal Bank (RY.TO) through your online brokerage account, you can then call your broker and ask him to journal (transfer) the shares over to the same listing in the foreign currency, at the market exchange rate, and then sell the shares in the currency you want to end up with.

This strategy would convert money invested in Canadian dollars in Royal Bank shares into U.S. dollars once you sold the same shares on the U.S. markets. The only fee paid would be the one charged on the buy and sell transactions. Depending on the amount converted, the transaction fee would be minimal.

Now that this strategy has been spread around Canadians, there are cheaper ways to apply Norbert’s Gambit strategy. Here’s how I convert my CAD to USD or vice versa:

How to Use Horizons US Dollar Currency ETF (DLR and DLR.U) to Convert Your Currency

The stock market is filled with great minds ready to make a buck on a good idea! This is how Horizons created two ETFs which sole purpose is to be used to convert CAD and USD.

  • Horizons US Dollar Currency ETF (DLR.TO)
  • Horizons US Dollar Currency ETF (DLR.U.TO)

Therefore, whenever you want to convert Canadian dollars into U.S. dollars, you can do it without paying any conversion fees!

First, you must first open two non-registered online brokerage account: One in Canadian dollar and the other one in U.S. dollar. You can open them within literally 15 minutes with Questrade (watch my step-by-step tutorial). You must also have two bank accounts (one in CAD and the other one in USD).

Your CAD bank account must be linked to your online CAD non-registered brokerage account. Same for your USD accounts.

Can I use Norbert’s Gambit with my RRSP?

I’ve received this question many times: “Can I use Norbert’s Gambit to transfer CAD into USD in my RRSP account or does this strategy only works with non-registered accounts?”

You can use Norbert’s Gambit with an RRSP account. The principle is the same: you would need a CAD and a USD account and you follow the steps explained in this article. The only difference is that you don’t withdraw the money from the account at the end (you use your CAD to buy American stocks in your USD account for example). Keep in mind that dividends paid by US-based companies remain tax-free in an RRSP (as opposed to a withholding tax of 15% applied on dividends paid by a US-based company in a TFSA account).

You can also use Canadian Depositary Receipts (CDRs) to buy US stocks with a currency hedge.

Then, follow these steps to convert CAD to USD with no fees

#1 Transfer your money into your non-registered online brokerage account in Canadian dollar.

#2 Buy DLR.TO for the amount you wish to convert. DLR.TO trades like any other ETFs, you simply buy the number of shares times the price. For example, DRL.TO trades at $13.45 and you wish to convert $1,345. You will then buy $1,345 / 13.45 = 100 shares of DLR.TO.

Wait for the transaction to settle. This is the same process for any stock transactions.

#3 Transfer your position from DLR.TO to DLR.U.TO. Many brokerage services allow you to do it online. Some others will request a call or an online message through their contact form. The broker will give you exactly 100 shares of DLR.U.TO at a price in U.S. currency.

#4 Go in your U.S. non-registered account and sell your shares of DLR.U.TO

#5 Transfer your U.S. Dollar into your U.S. bank account.

Voila!

If you want to transfer USD into CAD you simply follow the exact same steps, but start with your U.S. account and buy DLR.U.TO first.

Please note the conversion could take about 5 to 6 business days between the time you send your money to your brokerage account and you receive it back in the other currency.

Norbert’s Gambit Real-Life Example

You may wonder if it’s worth your time to open two brokerage accounts and wait a few days for both transactions to settle right? I ask myself the very same question. Here are real my results using a transaction of transferring $7,003.04 USD into CAD in my business account (my business made sales in U.S. dollars and I needed to convert it into Canadian dollars).

First, I went to my U.S. bank account and tried to convert a small USD amount into CAD to see the rate. As you can see, the rate offered was 1.3003 (while they clearly show the real rate at 1.3254 at the bottom of the page).

Converting CAD to USD

I decided to skip the middleman and applied the Norbert’s Gambit strategy: I then sent my $7,000 USD into my USD online brokerage account on February 12th 2020 and bought 692 shares of DLR.U.TO and I waited.

DLR Horizon USD ETF

A couple of days later, I called my broker and ask to transfer those 692 shares of DLR.U.TO into 692 shares of DLR.TO in my Canadian dollar brokerage account. That was literally a 2 minutes call.

The same day, my Canadian account shows 692 shares of DLR.TO for the amount of $9,265.88.

I waited again for the transaction to settle and I sold my 692 shares a few days later. I then have the total amount transferred to my Canadian dollar business bank account.

On February 20th 2020, I had $9,265.88 deposited in my bank account showing a conversion rate of 1.3231 on my money (7,003.04 * 1.3231 = ~$9,265.88). If I had called my bank to convert on February 20th, they would have given me $1.2996 for each dollar. That’s a difference of 2.35% or $164.73.

Norbert's Gambit

Norbert’s Gambit takes a few days to operate

As you can see in my example, the conversion is not done instantly. This is probably the strategy’s biggest drawback. In times of high volatility, this is not ideal. You could be waiting and the currency you want could increase by 2% in a single day. On the other side, the 2% you save on the conversion rate makes a solid margin of safety.

Final thoughts

As a business owner, you can guess that I have to use Norbert’s Gambit on a regular basis to change my money from USD to CAD.

So far, it has paid off to save roughly 2.3% on each currency conversion.

I haven’t run into any major problems and I’m glad to keep saving so much money in currency conversion! What about you? Did you ever used Norbert’s Gambit?

High Yield Canadian REITs

REITs are companies primarily engaged in Real Estate and source most of their income from rents. To qualify as REITS (tax purposes) they need to distribute more than 90% of their net income to shareholders. This amongst other factors makes REITs a great option for income seekers looking for stable and decent dividends. At DSR we track 47 Canadian REITS! From that list, today we will be covering some of the higher-yielding companies (over 5% dividend yield). Although this might sound very appetizing make sure you do your due diligence because high yield is not always the same thing as high quality.

  1. Make sure you find a healthy dividend growth rate in the last few years (at least 5 years). If the company is increasing dividends at a rate lower than inflation, it means every single year you are getting a smaller paycheck.
  2. Some of these higher-yielding companies could also be dividend traps just looking to attract investors and their dividend is not sustainable, that is why you need to make sure you take a close look at the payout ratio (remember with REITs you use funds from operations (FFO) and not net income).
  3. Last but not least take a look at their track history, have they cut dividends in economic downturns? If they have how fast did they recover? This could give you an idea of what to expect next time things get rough for these companies.

For more REIT investing guidelines, please refer to the Canadian REITs Beginner’s Guide.

BTB REIT (BTB.UN.TO)

Market Cap: $271M

Dividend Yield: 9.14%

Subsector: Diversified (Retail, Office, and Industrial)

BTB high yield REIT

BTB Real Estate Investment Trust (the Trust) is a Canada-based real estate investment trust (REIT). The objective of the REIT is to generate stable and growing cash distributions on a tax-efficient basis from investments in a diverse portfolio of income-producing properties, with a primary focus in Quebec; to expand the real estate asset base of the REIT and increase its income available for distribution through an accretive acquisition program, and to enhance the value of the REIT’s assets and maximize long-term Unit value through the active management of its assets. The Trust owns approximately 75 properties, representing a total leasable area of approximately 5.9 million (M) square feet. It is an owner of properties in eastern and western Canada. It also offers a distribution reinvestment plan to unitholders. The Company operates through three segments, namely Industrial, Off downtown core office, and Necessity-based retail.

In September, BTB REIT reported strong revenue growth (+11%), but failed to reflect this performance in its AFFO per unit (-7%). Revenue growth was driven by strong rental activity and recent accretive acquisitions. Furthermore, BTB’s net operating income increased by 13% and its leasing efforts improved the occupancy rate of the properties by 1.6% compared to the same quarter of 2021. AFFO per unit was down due to a one-time additional recovery of $2.6M and an indemnity collection thereby increasing the revenues for that period last year. The dividend is safe with an AFFO payout ratio of 65.5% for the quarter and 67.8% for the first six months of the year.

Slate Grocery REIT (SGR.UN.TO)

Market Cap: $783M

Dividend Yield: 9.20%

Subsector: Retail (Grocery)

SGR.UN Canadian REIT

It is known that we are not fans of brick-and-mortar REITs at DSR. However, Slate Grocery REIT focuses solely on grocery-anchored commercial properties, which are generally buffered against the competition from e-commerce. The REIT counts Walmart (6.2% of base rent) and Kroger (8.1%) as its top tenants. We also like SGR’s geographic diversification across Florida (15.5%), North Carolina (14.1%) and Pennsylvania (10.4%). This combination of strong tenants and good geographic diversification has led to a high rent collection rate in 2020. Slate Grocery boasts a defensive portfolio of tenants including 64% of its base rents linked to groceries (38%), essential services (14%), or medical and personal services (13%). Despite its strengths, this REIT still has a weak dividend growth policy.

In August, Slate Grocery REIT reported good growth this quarter (revenue up 18%, AFFO per unit up 5%). This brought the AFFO payout ratio from 100% last year to 98%. On July 15, 2022, the REIT completed the acquisition of 14 properties for $425 million, which represents a low acquisition basis of $174 per square foot with below-market rents. The Portfolio increases the REIT’s exposure to the rapidly growing Sunbelt Region of the U.S. and includes a wide range of high-performing grocers, including Publix, Ahold Delhaize, Albertsons, and Walmart Occupancy has increased by 20 basis points since the most recent quarter to 93.4%.

Smart REIT (SRU.UN.TO)

 Market Cap: $4.37B

Dividend Yield: 7.20%

Subsector: Diversified (Retail, Multifamily, Office, and Self-Storage)

SmartCentres REIT

SmartCentres’ strengths lie in its long-term partnerships with retail giants such as Walmart, Canadian Tire, TJX and Loblaws. We like how SRU has integrated drugstores and grocery stores into each mall. This ensures a constant flow of customers for all the other retailers. SRU doesn’t just count on its strong relationships with stellar tenants to ensure growth. Management has recently increased its focus on 5G towers, EV charging stations, and pickup services (to compete against e-commerce). SRU also has an “intensification plan,” where it will develop various property types (residential, hotels, office buildings, etc.) in fast-growing cities. SRU is in the midst of an ambitious expansion and diversification project where a total of $15B will be invested. This is a great way to ensure diversification away from large retailers going forward. SmartCentres’ intensification program is expected to produce an additional 58.6 million square feet of space.

In September, SmartCentres reported a good quarter with revenue up 2% and FFO up 6%. The payout ratio for the quarter is at 90%, down from 99% last year. If the REIT continues on this track, we could talk about a distribution increase next year. Shopping centre leasing activity continues to improve with occupancy levels, inclusive of committed deals, increasing to 97.6% in Q2 2022, representing a 40 basis points increase from Q1 2022. SRU received zoning approvals for over 3.8 million square feet of residential development in the second quarter on 3 projects in the Greater Toronto Area.

Truth about REITs

As you can tell, finding the perfect REITs for your portfolio is not an easy task. Especially when looking for high-yield REITs, there are a lot of factors that you need to consider in order to be able to sleep well at night. You want to add to your portfolio a stable business with enough growth to at least beat inflation. If you get down to the weeds, looking at the actual portfolio and its growth might be a good resource to look into the future. At DSR we give you the tools to make sure you put your money to work with stable and growing companies so you can enjoy your passive income on the things that matter most!

Those REITs are great, but there is more!

We are now in market correction territory, and the fear of losing more money is growing. What will happen if we keep up with continuous high inflation?

If you look at past performances, Real Estate Income Trust is one of the best performing classes during high inflation periods since the 70s. Unfortunately, not all REITs are created equal and you must do adequate research to make sure you buy the right ones.

In this webinar, I will answer questions like:

  • How about REITs paying a 10% yield
  • How to make sure the REIT’s distribution is safe
  • Which metrics to consider during my analysis?
  • Should I consider mortgage REITs?
Watch the free Webinar replay here

Enbridge, Is the 6% Yield Safe?

Summary

  1. Enbridge offers a generous yield (6%), is it safe?
  2. ENB is responsible for about 25% of crude oil and 22% of all-natural gas transportation in North America.
  3. ENB generates substantial cash flow, and management is usually on target with its guidance.
  4. Finally, regulators may not be as enthusiastic as Enbridge is regarding new pipeline projects.

My Investing Thesis

ENB’s customers enter 20-25-year transportation take or pay contracts. This means that ENB profits regardless of what is happening with commodity prices. ENB is also well positioned to benefit from the Canadian Oil Sands as its Mainline covers 70% of Canada’s pipeline network. As production grows, the need for ENB’s pipelines remains strong. Following the merger with Spectra, about a third of its business model will come from natural gas transportation. Enbridge has a handful of projects on the table or in development. It must deal with regulators, notably for their Line 3 and Line 5 projects. Both projects are slowly but surely developing. The cancellation of the Keystone XL pipeline (TC Energy) secures more business for ENB for its liquid pipelines. ENB now has a “greener” focus with its investments in renewable energy.

Enbridge dividend yield

Business Model Explained to a 12 Years Old

What is nice about pipelines is that they are like a toll roads. The only difference is that you have no choice to take that road and pay the toll if you want to travel. The best part is that most Enbridge clients enter in 20-25 years transportation contracts. Therefore, no matter what happens, there are always people paying the toll. The cash flow is easy to predict in the future which leads to steady dividend growth.

Enbridge operates the longest pipeline in North America. The company recently merged with Spectra in order to create an energy infrastructure company. About 2/3 of ENB earnings is generated through oil sand (liquid pipelines) distribution while the other 1/3 is coming from natural gas transmission.

Source: Enbridge

Potential Risks

Stocks do not pay a high yield for no reason. ENB raised its debt and number of shares during the merger with Spectra and the integration of its partners a few years ago. The total long-term debt stands at around $76B (up from $67B in 2017) with no sign of being reduced. It’s time that investors see some debt repayment. As pipelines require significant amounts of capital to build and maintain, ENB may find itself in a position where cash is short. After all, management has plenty of projects to fund, a double-digit dividend growth promise to keep, and larger debts to repay. This could seriously jeopardize ENB’s growth plans. Many pipeline projects have been revised or paused by regulators over the past few years.

Enbridge debt

Dividend Growth Perspective

The company has been paying dividends for the past 65 years and has 27 consecutive years with an increase. Further dividend growth shouldn’t be as generous as compared to the past 3 years (10%/year). Management aims at distributing 65% of its distributable cash flow, leaving enough room for CAPEX. Look to their latest quarterly presentation for their payout ratio calculation. Management expects distributable cash flow growth of 5-7% annually. Therefore, you can expect a similar dividend growth rate. We have used more conservative numbers in our DDM calculation that are more in line with the 2021 and 2020 dividend increases of 3%.

Enbridge safe dividend

An exclusive list of dividend growers with more potential…

Moose Markets presents the Canadian Dividend Rock Stars list: a selection of Canadian companies showing income and growth. You guessed it; we prefer a combination of dividend growth and dividend yield. The Canadian Rock Stars List is a selection of the safest dividend stocks in Canada.

GET THE LIST NOW

Disclaimer: I am long ENB in my Dividend Stocks Rock portfolios.


Best Canadian REITs with a Safe Dividend

Real Estate Income Trusts or REITs are known to be retirees’ best friends. Why? Because they share several key factors for income-seeking investors. Notably, Canadian REITs are known for the following:

  • Their generous dividend yield (may offer a yield over 3%)
  • Many pay their distribution monthly (fits well with your budget!)
  • REITs operate stable businesses (recession-proof!)
  • Their goal is to distribute as much money as possible (isn’t what you are looking for?)
  • They are an excellent inflation hedge! (most of them have contracts with escalators clauses).

Before we jump to the Best Canadian REITs

While REITs are great to generate income at retirement, they can’t be analyzed using the same metrics as dividend stocks. For example, REITs don’t pay dividends, they pay a distribution that could be a mix of dividend, return of capital, and income. Therefore, REITs distributions are not eligible for the tax credit! Don’t worry, if you invest in a registered account such as an RRSP or a TFSA, you’re all good.

Besides their distribution, there are other characteristics that make REITs a unique investment type. Here are a few of them.

REITs valuation

Valuing a REIT is like valuing any stock. I generally use the Dividend Discount Model, since most of their profits are paid as dividends.

There are, however, a few key metrics to know.

Net Asset Value (NAV) is another estimate of intrinsic value. It’s the estimated market value of the portfolio of properties, and it can be determined by using a capitalization rate on the current income that is fair for those types of properties. This can potentially understate the value of the properties because properties may appreciate rather than depreciate over time.  Compare the NAV to the price of the REIT.

Funds from Operations (FFO & AFFO)

The Funds from Operations (FFO) are far more important than net income for a REIT. To determine net income, depreciation is subtracted from revenues. Since depreciation is a non-cash item, it might not represent a true change in the value of the company’s assets. FFO calculation adds back depreciation to net income to provide a better idea of what the cash income is for a REIT.

Adjusted Funds from Operation (AFFO) is arguably the most accurate form of income measurement of all regarding REITs since it takes FFO but then subtracts recurring capital expenditures on maintenance and improvements. It is a non-GAAP measure, but a very good measure for the actual profitability and the actual amount of cash flow that is available to pay out in dividends.

So rather than look to Earning per Share (EPS), which is calculated using net income, for REITs, look for the FFO per unit or AFFO per unit.

Overall, it is good to look for REITs that have diversified properties, strong FFO and AFFO, and a good history of consistent dividend growth.

Top 3 Largest Canadian REITs

One way to classify REITs is by market cap. Many investors feel more comfortable selecting a well-diversified business with a large property portfolio. Some REITs are present in many cities and provinces providing optimal geographic diversification. Here are the three largest Canadian REITs:

Canadian Apartment Properties REIT (CAR.UN.TO)CAPREIT Logo

  • Market Cap: 8B
  • Dividend Yield: 3.06%
  • Sub-Sector: Residential

If an investor is looking for a steady source of income that will keep up with inflation, CAPREIT should be on their watchlist. In addition to enjoying a strong core business in Canada, CAPREIT is expanding its business in Ireland and the Netherlands. This gives them additional geographic diversification. CAPREIT continues to exhibit high-single-digit organic growth while raising additional funds to acquire more buildings. Unfortunately, the REIT neglected to increase its dividend in 2020. We cannot blame management for being overly cautious over the pandemic; they were fortunately stronger in 2021 and won back their dividend safety score of 3.

Graphs showing Canadian Apartments REIT's stock price, revenue, FFO per share and dividends paid over 5 years

Dividend Growth Perspective

Over the past 5 years, management has been able to steadily increase its monthly distribution. The REIT continued its dividend growth tradition with a modest increase in 2019 (+3.6%). Management has proven its ability to grow its revenue both organically and through acquisitions. After taking a pause in 2020, CAPREIT came back with a generous dividend increase (+5.2%) from $0.115 per share to $0.121 per share earlier in 2021. The REIT won back its dividend safety score of 3 as it exhibits a strong FFO payout ratio of 62.6% for the full year of 2021. You can expect another dividend increase in 2022! The recent stock price drop brought the yield to about 3%; this looks like a good deal if you are prepared to be patient (e.g., expect more volatility throughout the rest of the year).

RioCan REIT (REI.UN.TO)

  • Market Cap: 5.5B
  • Dividend Yield: 5.9%
  • Sub-Sector: Retail

The REIT boasts an impressive occupancy rate. Over the past couple of years, REI sold non-core assets to concentrate on what they know best. We like management’s new focus, and we think it will help build additional value for investors into the future. RioCan can count on solid growth going forward, with 90% of its rents coming from the top 6 markets in Canada (with roughly 50% coming from the Greater Toronto Area).

Unfortunately, the REIT must face constant headwinds coming from the retail brick & mortar industry. For this reason, RioCan is pursuing residential urban development projects (80%+ of its current pipeline). This could be an interesting growth direction, but we wonder: will it be enough to compensate for the brick & mortar retail industry’s slowdown? In the meantime, REI increased its FFO per unit by 7% for the full year of 2022 and it has several projects in its pipeline. We see continuity in FFO per unit growth in 2023. The REIT exhibits a strong balance sheet and a low payout ratio.

Gra[hs showing Riocan's stock price, revenue, FFO per share, and dividends paid over the last 5 years

Dividend Growth Perspective

An investor shouldn’t expect much in terms of short-term dividend growth. When calculated using the DDM, we used a 3% dividend growth rate now that the REIT freed up some cash flow and increased its distribution by 6.25% in 2021. Let’s hope that their plans to expand into offices and apartment buildings will be profitable. The FFO payout ratio will be in line, but we expect RioCan to be more prudent with its cash flow. As expected, the REIT offered a dividend increase in 2023 (+5.88% from $0.085/share to $0.09/share).

Granite REIT (GRT.UN.TO)

Granite REIT logo

  • Market Cap: 4.8B
  • Dividend Yield: 4.41%
  • Sub-Sector: Industrial

GRT used to be an extension of Magna International (MG.TO). In 2011, Magna represented about 98% of its revenues. It is now down to 25% as of November 2023 (with Amazon as its second-largest tenant with 4% of revenue). You’ll notice that each year, GRT reduces its exposure by a few percentage points. Management has transformed this industrial REIT into a well-diversified business without adversely affecting shareholders. GRT now manages 138 properties across 7 countries. Each time we review this stock card, the number of properties increases while the exposure to Magna Intl reduces. The REIT also boasts an investment grade rating of BBB/BAA2 stable. With a low FFO payout ratio (around 70-75%), shareholders can enjoy a 5% yield that should grow and match or beat the inflation rate. This is among the rare REITs exhibiting AFFO per unit growth while issuing more units to finance growth.

Graphs of Granite REIT stock price, revenue, FFO per share and dividends paid over 5 years

Dividend Growth Perspective

GRT has maintained a solid dividend growth policy over the past 5 years (4%+ CAGR). With its FFO payout ratio well under control shareholders should expect a mid single-digit dividend growth rate going forward. The AFFO payout ratio was under 73% for Q3 2023 (reported in November 2023). You can expect more distribution increases going forward! The company even paid a special dividend in 2019. If the Magna International business is doing well, GRT will perform and keep increasing its dividend. The REIT offered a conservative distribution increase in November of 2023 with a raise of 3.125%.

We issued a buy rating on Granite a while ago. Even with the stock price bouncing back a bit, it’s still a buy.

Highest Yield REITs

If you are retired, your main concern may be how much income your portfolio can generate. In this case, you may be interested in finding out the most generous REITs. A word of caution, a very high yield isn’t necessarily a sign that all is  great, always make you due diligence when researching REITs to choose the best and safest. More information about that later in this post.

AP.UN.TO logoAllied Properties REIT (AP.UN.TO)

  • Market Cap: $2B
  • Dividend Yield:10.29%
  • Sub-Sector: Office

Allied features one of the strongest balance sheets among Canadian REITs. It has much of its capital invested in low-cost projects and is currently paying down higher-interest debt at the same time as investing in new projects. AP maintains its unique expertise in managing and developing prime heritage locations, which will continue to be in high demand in the coming years. The REIT also counts on many technology clients, which represent a growing sector in Canada. There are still concerns surrounding office REITs (AP generates ~70% of its income from offices), but this REIT has proven its resilience in difficult times. The 2023 distribution increase (+2.7% in early 2023) and low payout ratio for a REIT are good signs. AP will sell its data centers to bank highly valued assets in order to purchase more undervalued ones (office properties). This could be a very strong move. However, AP remains a high-risk, high-reward play, but please proceed with caution.

Graphs of Allied Properties REIT's stock price, revenue, FFO per share, and dividends paid over the last 5 years

Dividend Growth Perspective

In evaluating a REIT, we hope that the dividend increase will at least match inflation. This is the case with AP. The company has posted a 2.5% dividend CAGR over the past 5 years and exhibits healthy FFO and AFFO growth. An investor can therefore, expect 2-3% annual dividend growth going forward. For the full year of 2022, the REIT exhibits an AFFO payout ratio of 81%. Allied increased its distribution by 2.7% in 2023 (after a 3% increase in 2022), bringing its annual distribution payment to $1.80/share. This demonstrates strong confidence from management and pleasant news for shareholders! However, it doesn’t mean it’s a smart move…

Canadian Net REIT logoCanadian Net REIT (NET.UN.V)

  • Market Cap: $102.7M
  • Dividend Yield:6.87%
  • Sub-Sector: Diversified

This is an interesting small REIT that has flown under the radar. Canadian Net REIT enjoys stable cash flows from its properties under the triple net lease formula (tenants handle insurance, taxes, and maintenance costs). Triple net lease REITs let tenants manage more risk as they handle all expenses involving the property. The REIT has high quality tenants such as Loblaws (25% of NOI), Walmart (11%), Sobeys (10%), Suncor (7%) and Tim Hortons (6%). The REIT’s portfolio makes this company quite resilient to any kind of recession. The bulk of its properties are situated in the province of Quebec, with a small number in Ontario and the Maritimes. We should keep in mind that the company trades on the TSX Venture. This small cap (approximately $100M of market capitalization) is subject to low trading volume and strong price fluctuations. Monitor this one quarterly to make sure the situation remains stable. Always proceed with caution with small caps.

Graphs showing Canadian Net REIT's share price, revenue, FFO per share, and dividends paid over the last 5 years

Dividend Growth Perspective

Don’t be alarmed by the dividend drop in 2018, as the REIT simply changed its payment schedule. In fact, this small cap has been continually increasing its dividend since its IPO in 2011. The FFO payout ratio hovers between 55% and 65% as their FFO per unit grew just as quickly as its dividend in the past decade (in fact, it grew even faster). Unfortunately, while management claims the distribution is safe with a payout ratio of 62%, it didn’t announce an increase. Following the small increase of 2023 (+3.6%) and no increase for 2024, the REIT is likely going to lose its dividend safety score of 3 if it doesn’t increase its distribution later in 2024. Revenue increased through higher rental income, but higher interest charges affected the FFO. Proceed with caution with this small cap.

CT Real Estate Investment Trust logo

CT REIT (CRT.UN.TO)

  • Market Cap: 2BM
  • Dividend Yield:6.25%
  • Sub-Sector: Retail

An investment in CT REIT is primarily an investment in Canadian Tire’s real estate business. If you think this Canadian retail giant will do well in the future, but you are more interested in dividends than pure growth, CT REIT could be a good fit for you. Canadian Tire has exciting growth plans that will eventually lead to more triple-net leases for CT REIT. The fact that CRT pays a monthly dividend with a 6% yield is highly attractive to income-seeking investors. On top of that, CT REIT exhibits a decent dividend growth rate policy, matching and beating inflation over the long haul. In the past 10 years, the company grew its revenue and AFFO by mid-single digits numbers. This makes it a perfect candidate for an income-focused portfolio. Canadian Tire has done well in the past 5 years thus far and has proven the resilience of its business model. It’s a sleep well at night REIT that should please all income-seeking investors.

Graphs showing CT REIT's stock price, revenue, EPS and dividends paid over 5 years

Dividend Growth Perspective

This REIT continues to grow and maintain a low AFFO payout ratio of 75% for full year 2022. The AFFO payout ratio for the first nine months of 2023 is at 73.2% (slightly below 2022 numbers). This means your distribution will likely continue to increase faster than the inflation rate going forward. Shareholders can expect to cash in a solid 6% yield with a ~3% growth rate. This is a perfect example of a sleep-well-at-night type of holding. After a small increase in 2020 (+1.5%), CT REIT came back strong with increases of 4.5% and 3.3% in 2021 and 2022, respectively. Keep in mind that many retail REITs cut their dividend over the pandemic. CT REIT has proven that an investor can trust the company to be part of their retirement plan. CT REIT rewarded investors with another 3.5% distribution increase in 2023. Even with a conservative DDM calculation (expected dividend growth of 3%), the REIT offers an attractive entry point at a price below $15.

My Favorites 

Finding the perfect REITs isn’t easy. As a dividend growth investor, I look for a combination of a stable business with some growth perspective. I like when management can grow their property portfolio through investments and acquisitions while increasing distributions enough to beat inflation. I found this perfect balance among these three Canadian companies, which happen to be either among the largest or the highest-yield REITs we covered earlier in this post:

Granite REIT (GRT.UN.TO)(GRP.U)

CT Real Estate Investment Trust (CRT.UN.TO)

Canadian Apartment Properties REIT (CAR.UN.TO)

Learn how to invest in REITs

Unfortunately, not all REITs are created equal and you must do adequate research to make sure you buy the right ones.

Watch this webinar, in which I answer questions like:

  • How about REITs paying a 10% yield
  • How to make sure the REIT’s distribution is safe
  • Which metrics to consider during my analysis?
  • Should I consider mortgage REITs?
Watch the free Webinar replay here
  • « Go to Previous Page
  • Page 1
  • Interim pages omitted …
  • Page 9
  • Page 10
  • Page 11
  • Page 12
  • Go to Next Page »

Copyright © 2025 · Moose Markets