• Skip to main content

MOOSE MARKETS

INVESTING THE CANADIAN WAY

  • Dividend Investing
    • Best Canadian Stocks to Buy in 2025
    • Dogs of the TSX – Beat The TSX! 2025
    • Canoe Income Fund
    • Canadian Banks Ranking 2025
    • Canadian Dividend Rock Stars List
    • Canadian Dividend Aristocrats 2025
    • Buy and Hold Forever Stocks
  • REITs
    • Canadian REITs Beginner’s Guide
    • Best Monthly REITs 2025
  • How To
    • Income Products at Retirement
    • 4 Budgets of Retirement
    • Create a Cash Wedge at Retirement
    • 5 Questions for a Confident Retirement
  • ETFs
    • Guide to ETF Investing
  • Portfolio Strategies
    • Canadian Depositary Receipts (CDRs)
    • Building an Income Portfolio – Made Easy
  • Newsletter
  • Podcast

Mike

The Canadian Guide to ETF Investing: Simplicity, Security & Smart Income

If there’s one thing retirement should bring, it’s simplicity.

You’ve worked hard, saved diligently, and now it’s time to put your money to work—with minimal hassle and maximum peace of mind.

For Canadians investing for retirement, ETFs are one of the best-kept secrets in plain sight.

In this article, we’ll explore:

  • What ETFs are

  • How to use them in retirement

  • Why ETFs belong in your toolbox—but not your core plan

  • And how to avoid the #1 trap

Why ETFs Are the “Easy Button” for Retirees

Let’s be honest: once you retire, the last thing you want is to babysit a complex, high-maintenance portfolio. You don’t want to track 45 stocks or time the market. You want income, simplicity, and peace of mind.

That’s where ETFs (Exchange-Traded Funds) come in.

These low-cost, diversified bundles of investments are perfect for Canadians who want a hands-off strategy that still delivers results—and they’re especially powerful in retirement.

What Is an ETF?

An ETF is a basket of stocks, bonds, or both you buy on the stock exchange. Think of it like buying a package of investments in one easy trade.

You’ll find ETFs for nearly everything:

  • 🇨🇦 Canadian dividend payers

  • 🇺🇸 U.S. market leaders (e.g., S&P 500)

  • 🌎 Global tech and emerging markets

  • 💵 Bonds and fixed income

  • 🧊 Even Cash ETFs (we’ll get to these soon)

Why retirees love them:
ETFs offer instant diversification, low fees, and fewer decisions to make. You can build a complete retirement portfolio with just one or two ETFs.

Looking for Retirement Income? Here’s Your Guide!

Income products reviewed cover.

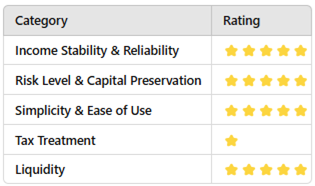
This free guide reviews 20 income-focused products. In the one-page summaries, we highlight the pros and cons, common mistakes to avoid, and who should use them.

We also created a rating system to highlight the difference between each product. The idea is to provide you with as much information as possible so you can make the right choice for your situation.

While there is no free lunch in finance, there are multiple ways to reach your retirement goals.

Download The Canadian Retiree’s Guide to Income-Producing Investments Now!

How Would I Invest $1M Using ETFs?

Let’s say I’m retired today with $1 million and want to keep it simple. Here’s how I’d break it down:

Option 1: Balanced & Reliable (60/40 mix)

  • 60% equity ETFs for growth and dividends

  • 40% bond ETFs for stability

📈 Goal: Generate $30K–$40K in annual income and preserve capital.

Example ETFs:

  • XEI.TO (Canadian dividends)

  • ZAG.TO (Canadian aggregate bonds)

Option 2: Growth-Focused (80/20 mix)

  • 80% equities for long-term compounding

  • 20% fixed income for cushion

Example ETFs:

  • VFV.TO (S&P 500)

  • XIU.TO (TSX 60)

  • ZAG.TO (bonds)

Option 3: All-in-One Simplicity

If I didn’t want to deal with asset allocation at all? I’d go with a single all-in-one ETF that already includes everything.

Top all-in-one picks:

  • VBAL (60/40)

  • VGRO (80/20)

  • XEQT (100% equity)

  • XGRO / ZGRO – Canadian alternatives

📌 Why I like them:

  • Global diversification

  • Automatic rebalancing

  • Extremely low MER (~0.25%)

  • Perfect for monthly withdrawals

Honestly, this is the strategy I’d hand to my spouse if she had to manage our finances solo.

To give you an idea of the returns an all-in-one ETF can offer, I have analyzed XEQT in the video below.

Where Do Cash ETFs Fit In?

Cash ETFs are like a high-interest savings account inside your brokerage account. They hold short-term government securities or T-bills and pay interest monthly.

🔍 When to use them:

  • Emergency fund

  • Cash reserve for the next 1–3 years of expenses

  • Temporary “parking spot” for your money

✅ Pros:

  • Very low risk

  • Highly liquid (sell anytime)

  • Monthly income

❌ Cons:

  • Modest returns that won’t keep up with inflation

  • Fully taxable as interest income (unless held in a TFSA/RRSP)

  • Not a growth tool—just a buffer

💡 Pro tip: Use Cash ETFs in a bucket strategy to smooth out withdrawals and avoid selling equities during downturns.

Don’t Overdo It: Avoid ETF Overload

One of the most common ETF investing mistakes? Buying too many. Here’s what happens:

“I’ll buy one Canadian dividend ETF… oh, and a U.S. dividend ETF… and maybe a global growth one… and a few sector ETFs… and—wait, why do I own 1,200 companies now?”

Here’s the truth: most ETFs already own hundreds (or thousands) of holdings. Buying more means duplication, higher fees, and decision fatigue.

🎯 Keep it tight:

  • 1 ETF → All-in-one solution

  • 2–3 ETFs → Perfectly fine for a balanced strategy

  • 4+ → You better have a solid reason

Mike’s Simple ETF Selection Checklist

Whether you’re building a brand-new ETF portfolio or fine-tuning an existing one, this no-nonsense checklist will keep you on track:

✅ Start with your goal – Income, growth, or balanced?
✅ Stick with trusted providers – Vanguard, iShares, BMO, Horizons
✅ Compare MERs – Under 0.30% is ideal
✅ Check top holdings – Avoid overlap
✅ Currency exposure – Hedged or not? Know what you’re buying
✅ Assets Under Management (AUM) – Larger = more liquidity

Why All-In-One ETFs Are My Favourite Option for Retirees

I’ve said it before, and I’ll say it again: if I ever stop picking stocks, I’m going all-in on all-in-one ETFs.

They’re simple, cost-effective, globally diversified, and handle rebalancing for you. No spreadsheets, no second-guessing, no stress.

Imagine having just one line on your investment statement… and knowing it includes thousands of companies worldwide. That’s not just convenience—it’s smart portfolio design.

If you’re a retiree looking to draw income each month, all-in-one ETFs make it ridiculously easy. Just sell a few units when needed. Done.

Final Thoughts: Build a Retirement Portfolio That Works for You

Here’s what I’ve learned after more than a decade of working with dividend and ETF investors:

👉 You don’t need to make it complicated to be successful.
👉 The best portfolio is one you understand—and can stick with.
👉 ETFs give you instant access to diversification, low fees, and income.
👉 All-in-one ETFs are perfect for Canadians who want a hands-off solution.
👉 Cash ETFs aren’t the main dish, but they’re a great side.

And above all, remember: your plan only works if you actually follow it.

Don’t let perfectionism delay progress. Whether you build a 3-ETF mix or go with a single all-in-one fund, the key is to stay invested and consistent.

Learn More about 20 Income-Focused Products

Example of the ratings found in the free income-products guide.

With that in mind, remember to grab your free copy of The Canadian Retiree’s Guide to Income-Producing Investments! You’ll be well-aware of the pros and cons of each to make the best decision for your situation and goals.

I WANT TO DOWNLOAD THE GUIDE NOW

Canadian REITs Beginner’s Guide

Want exposure to real estate without the hassle of fixing leaky faucets or chasing tenants for rent? That’s where Canadian REITs come in. These high-yield investments offer steady income, inflation protection, and real estate exposure — minus the landlord stress.

Thanks to their unique tax structure, REITs are designed to return most of their income to shareholders, making them ideal for income-seeking investors.

What Are REITs & Why They Matter?

REITs are not only popular because they distribute generous dividends, but also because they’re easy to understand. Investors can picture an apartment building or an office tower and tenants paying their rent monthly. Investors are willing to purchase units of those businesses in exchange for the income and peace of mind.

The concept of being a landlord and having tenants is comparatively simple to understand. The company owns and manages real estate and receives rental income from properties such as apartment complexes, hospitals, office buildings, timber land, warehouses, hotels, and shopping malls.

Most REITs are equity REITs. They must invest most of their assets (75%) into real estate (properties) or cash equivalents. In other words, they cannot produce goods or provide services with their assets. They must generate 75% of their income from those real estate assets in the form of rent, interest on mortgages, or sales of properties.

REITs must also pay a minimum of 90% of their taxable income as dividends to shareholders each year. Therefore, the classic earnings per share (EPS) and dividend payout ratios don’t gauge an REIT’s health.

3 Types of REITs: Equity, Mortgage, and Hybrid

Equity REITs

Equity REITs own and invest in property. They may own a diversified set of properties, and they generate income primarily in rent payments from leasing their properties.

Mortgage REITs

Mortgage REITs, or mREITs for short, finance property. They generate income from interest on loans they make to finance property.

Hybrid REITs

Hybrid REITs do a bit of both, as they own property and finance property.

In general, REITs offer great investment opportunities by their nature. A growing economy leads to growing needs for properties. REITs can grow organically as the population requires more industrial facilities, healthcare centers, offices, and apartments.

Sub-Sector (Industry)

REIT – Diversified REIT – Mortgage REIT – Specialty
REIT – Healthcare Facilities REIT – Office Real Estate – Development
REIT – Hotel & Motel REIT – Residential Real Estate – Diversified
REIT – Industrial REIT – Retail Real Estate Services

The Hidden Strengths of REITs

REITs are unique as they distribute most of their income. In fact, they exist to pay generous distributions. This makes them one of the retirees’ favorite sectors!

Therefore, it’s easy to understand how most offer a relatively high dividend income. This is one of the rare sectors where you can find “relatively safe” stocks paying 5%, 6%, or even 7%+. Investors must be careful not to get too greedy, though. We have seen several REITs cut their dividends due to poor management or economic downturns.

REITs usually bring stability to a portfolio. It’s a great sector to start with if you want additional income. Real estate brings significant diversification to your portfolio. Research has proved that REITs are not directly correlated to stock market movements over the longer term.

Finally, since most of them operate with escalator contracts, they offer great protection against inflation. Many income trusts include yearly rent increases in their leases to ensure rental income matches inflation. Some REITs also use Triple-Net leases, where the tenants is responsible for insurance, taxes, and maintenance costs, thus reducing the REITs’ expenses (and risk of unexpected charges!).

REITs: The Risks You Need to Know

One of the REIT sectors’ favorite ways to finance their new projects is to issue more units. Therefore, if a company purchases a property generating $20M per year but needs to issue more units to finance the purchase, you must look at the net outcome for unitholders. If the FFO per share drops, this is not necessarily good for you as it will affect the REIT’s ability to increase its dividend in the future.

Another downside related to their business model is their lack of flexibility. We have often seen REITs try to shift their focus from one industry to another. In most cases (H&R, RioCan, Boardwalk, and Cominar, to name a few), the trajectory change comes with a dividend cut and a loss in value for unit holders. A REIT wishing to get rid of its shopping malls to buy more industrial properties will likely have to sell properties at a lower price and pay a hefty price to buy more appealing assets.

Finally, don’t make the mistake of thinking REITs are safer than other sectors. They are companies facing challenges while benefiting from tailwinds. While you may argue that an apartment building can’t go anywhere, I would answer that if you have one hundred empty apartments due to an oversupply in a neighborhood, your money will also go nowhere.

The REIT sector is best for income investors.

Target sector weight: For income-seeking investors, you can aim at 15% to 30% (if you invest in various industries). For growth investors, REITs could represent a 5%-15% portion of your portfolio.

Protect Your Portfolio: Canadian Rock Stars List

REITs can provide good income, but they are all part of the same sector. You need more diversification for your portfolio to be fully protected of market events.

Red star.

I have created a list showing about 300 companies with growing revenue, earnings per share (EPS), and dividend growth trends. Focusing on trends rather than numbers gives you a better perspective on past, present, and future growth.

The Dividend Rock Stars List is the best place to start your stock research. Get it for free by entering your name and email below.

How to Analyze a REIT (The 3 Must-Know Metrics)

While REITs are among a short list of sectors that are perfect for retirees or other income-seeking investors, it is important to understand that they cannot be analyzed using the same metrics as other sectors.

Funds From Operations (FFO/AFFO)

The Funds from Operations (FFO) and Adjusted Funds from Operations (AFFO) are probably the most valuable tools for analyzing a REIT’s financial performance. Those two metrics replace the earnings and adjusted earnings for a regular stock. While those are different metrics, it’s all about cash flow and the REITs’ ability to sustain their dividend payments.

Fortunately, we can find those metrics inside each REIT’s quarterly report and subsequent press release. It’s important to follow not only the total FFO/AFFO, but also the FFO/AFFO per share (or unit of ownership) rather than earnings per share (EPS) or adjusted earnings per share.

FFO = Earnings + Depreciation (Amortization) – Proceeds from Property Sales

AFFO = Earnings + Depreciation (Amortization) – Proceeds from Property Sales – Capital Expenditures

Loan to Value Ratio (LTV)

The loan-to-value ratio (LTV) is a great tool for analyzing the REIT’s future ability to raise low-cost capital. The LTV is easy to calculate from the financial statement, as you only need 2 measures of data:

LTV = Mortgage Amount / FMV of properties

You don’t want to invest in a REIT showing a high LTV. This means that their credit rating may be at risk and the price for future debt will be higher. In other words, it could mean less money for future dividends.

Net Asset Value (NAV)

The last metric to follow for REITs is Net Asset Value (NAV), which (usually shown in units) is equivalent to a price-to-book ratio.

NAV = Total Property Fair Market Value – Liabilities

The idea is to compare a few REITs from your list against one another. This is how you should be able to find the ones with the best metrics. A lower than industry NAV is either a riskier play or a value play. The AFFO and LTV will tell you which one it is.

Avoid This Common REIT Mistake

REITs are required to distribute at least 90% of their taxable income to investors, which makes traditional payout ratios less useful. The metrics you’re looking for is the Funds From Operations (FFO) and the Adjusted Funds From Operations (AFFO) payout ratios.

Funds from Operations Payout Ratio

Formula: DIVIDEND PER SHARE (DPS) / (ADJUSTED) FUNDS FROM OPERATIONS (FFO) PER SHARE

Because of REITs’ tax structure, adjusted funds from operations (AFFO or FFO) is a more precise metric. Like the payout and cash payout ratio, it’s always preferable to look at a long-term trend of the metrics over several years.

Pros: Similar to the cash payout ratio, this ratio clearly shows how much cash the company has to pay dividends.

Cons: In most cases, you can’t calculate the FFO payout ratio yourself or find it on general finance websites. You must rely on the company’s information found in their quarterly earnings reports. It requires additional time to establish a trend over several years.

How to Value a REIT Like a Pro

Valuing a REIT is like valuing any stock.

I generally use the Dividend Discount Model (DDM) to value them. However, some of the other REIT-specific metrics we’ve seen are also very valuable when valuing REITs.

Net Asset Value (NAV) is another estimate of intrinsic value. It’s the estimated market value of the portfolio of properties. One way to evaluate this value is to divide the current net income from the properties by a capitalization rate that’s fair for those types of properties. NAV can potentially understate the value of the properties because it might not capture value appreciation of properties during strong growth periods in the market. Compare the NAV to the price of the REIT.

We’ve seen that Funds from Operations (FFO) are far more important than net income for a REIT. Due to the tax structure of REITs, earnings mean almost nothing; instead, it’s all about cash flow. When calculating net income, depreciation is subtracted from revenues; depreciation is a non-cash item and might not represent a true change in the value of the company’s assets. FFO adds depreciation back to net income, providing a better idea of the cash income for a REIT.

Adjusted Funds from Operation (AFFO) is arguably the most accurate income measurement metric for REITs. AFFO takes FFO but then subtracts recurring capital expenditures on maintenance and improvements. It’s a non-GAAP measure but a very good gauge of the actual profitability and amount of cash flow available to pay out in dividends.

Overall, it’s good to look for REITs that have diversified properties, strong FFO and AFFO, and a good history of consistent dividend growth.

REIT advantages and disadvantages

Before presenting some of our picks for Canadian REITs, let’s sum up the advantages and disadvantages of REITs.

Advantages:

  • Usually have above-average dividend yields.
  • Are good protectors from inflation. Property values and rents increase over time if inflation occurs, but fixed-interest on the debt that finances the properties doesn’t.
  • Real estate, if managed conservatively, can be a reliable investment for income and in times of recession, assuming tenants pay their rent.

Disadvantages:

  • Often have lower dividend growth than companies in other sectors.
  • Generally use debt to add to their property portfolio, but their larger debt loads is used for conservative, appreciating assets.
  • Since they have to pay most of their income as dividends, they have little downside protection from recessions. They might have to trim the dividend if their cash flow dips below their distribution levels. There are, however, some REITs that have good track records of consistent dividend growth, despite market downturns.

For example, Granite REIT has consistently used conservative debt and escalator leases to grow dividends. Conversely, Northwest Healthcare REIT stumbled due to poor balance sheet management, overreliance on floating rate debt, and deteriorating cash flow, leading to a dividend cut in 2023.

GRT.UN.TO vs NHW.UN.TO 5-Year Dividend Triangle.

REIT Summary or Quick Reference Table

✅ REIT Cheat Sheet
Best For: Income-focused investors, retirees.
Top Metrics: FFO/AFFO, NAV, LTV.
Risks: Overconcentration, debt levels, and tenant health.
Watch For: Dividend sustainability and inflation-adjusted leases.

Top REIT Picks

Below are some of my favorite REITs in Canada, side-by-side. You can also find a complete description for each in this article.

Our top 3 favorite monthly REITs using the Stock Comparison Tool at Dividend Stocks Rock.

Get More Stock Ideas: The Canadian Rock Stars List

Red star.

REITs can anchor your income portfolio — but they’re just one piece of the puzzle.

Explore our Canadian Rock Stars List to discover 300 dividend-growing stocks showing a positive dividend triangle (5-year revenue, earnings per share (EPS), and dividend growth trends) with filters.

Start your stock research on the right foot with the best Dividend Stocks List. Enter your name and email below.

Best Monthly REITs 2025

Retirement’s knocking — but can your income keep up? If you’re dreaming of monthly paychecks without the headaches of tenants or property repairs, Canadian REITs could be your answer.

Most dividends come quarterly. But some REITs? They pay monthly, giving you that steady stream of income retirees love.

What makes REITs great monthly payers?

While most companies pay dividends quarterly, many Canadian REITs opt for monthly distributions. That’s because their rental income arrives monthly — and they’re happy to share it.

Think of REITs like owning a rental empire — without the late-night repair calls. These trusts collect rent monthly from dozens (or hundreds) of properties and pass that income straight to you.

Monthly distribution REITs list

Monthly distribution REITs
Monthly distribution REITs in Calendar (for entertainment purposes only).

At DividendStocksRock, we track over 1,200 dividend-paying stocks. Only 65 Canadian companies pay a monthly dividend from this list, and over half (34) are REITs.

Want to explore all your monthly income options? Here’s our complete list of Canadian REITs that pay monthly dividends, including their yields and dividend growth history.

Retirees: Not All Income Is Created Equal

Monthly distributions can feel safe — until they’re not. High-yield funds often cut payouts when you need them most.

Dividend Income for Life shows you a better way:
✅ Reliable, growing income from quality dividend stocks
✅ A strategy built to outlast market dips and inflation
✅ How to retire with income you won’t outlive

💡 If you’re retired (or close to it), this guide is your roadmap to income that grows with you.

Download it free and build the income your retirement deserves.

Our Top 3 Monthly REITs

Some of the best Canadian REITs are paying a monthly distribution. We picked three standouts from over 30 monthly-paying REITs based on yield stability, tenant diversification, debt or payout ratios, and long-term growth.

Granite REIT (GRT.UN.TO)

GRT.UN.TO 5-Year Dividend Triangle.

Investment Thesis: Diversified, Disciplined, and Growing

Granite REIT has transformed from a single-tenant industrial landlord into a diversified, growth-oriented real estate investment trust.

Once dependent on Magna International for 98% of its revenue, that figure has dropped to 26.7% as of August 2024. The trust now owns 143 properties across seven countries, with a growing tenant base including Amazon. Backed by a BBB/BAA2 investment-grade rating and a low FFO payout ratio (~70%), Granite offers a 4–5% dividend yield with inflation-beating growth potential.

Strategic acquisitions and developments aligned with e-commerce and supply chain trends continue to fuel expansion and de-risk the portfolio.

Potential Risks: Magna Still Matters

Despite Granite REIT’s successful diversification, key risks remain—most notably its ongoing dependence on Magna, which still accounts for over a quarter of its revenue. Any disruption in Magna’s business could impact Granite’s financial stability.

Broader economic downturns could also reduce demand for industrial space, leading to lower occupancy and rent collections. Rising interest rates present a further challenge, potentially increasing borrowing costs and pressuring profit margins.

The industrial REIT space is also becoming increasingly competitive, with rivals like Dream Industrial and Stag REIT actively pursuing premium tenants and properties, requiring Granite to enhance its value proposition continuously.

CT REIT (CRT.UN.TO)

CRT.UN.TO 5-year Dividend Triangle.

Investment Thesis: High Yield, Low Risk, and Long Leases

CT REIT is a stable, income-focused real estate investment trust that derives 92% of its rental income from Canadian Tire and its associated brands.

With a robust 6.3% dividend yield and a conservative AFFO payout ratio (~74–75%), it offers reliable monthly income backed by long-term, triple-net leases. The REIT owns 375 properties across Canada and continues to grow through acquisitions, intensifications, and development projects.

While its fortunes are tied closely to Canadian Tire’s performance, the trust benefits from high occupancy, mission-critical assets, and strong pricing power on renewals—making it an appealing choice for conservative, yield-seeking investors.

Potential Risks: When Your REIT Depends on One Retailer

CT REIT’s stability comes with concentrated risk—over 90% of its leasable area is tied to Canadian Tire.

This tight dependency means the REIT’s fortunes rise and fall with its anchor tenant. While Canadian Tire has been resilient, any strategic shift or decline in its performance could have ripple effects on CT REIT.

The trust also faces exposure to interest rate risk due to its $3B+ in debt and operates many properties in secondary markets, which are more vulnerable during economic downturns.

Despite solid management and stable cash flows, CT REIT lacks diversification, making it a high-conviction bet on a single retailer.

Canadian Apartment Properties REIT (CAR.UN.TO)

CAR.UN.TO 5-year Dividend Triangle.

Investment Thesis: Stable Income with Rental Growth Upside

Canadian Apartment Properties REIT (CAPREIT) is a leading residential REIT with over 48,000 rental suites across Canada and the Netherlands.

Known for its inflation-resistant cash flows and strong occupancy (97.5% in Q4 2024), CAPREIT offers steady income and long-term growth potential. It has delivered high single-digit organic rent growth while engaging in capital recycling—selling nearly $1 billion in Canadian assets in 2024 to optimize its portfolio.

With strategic property acquisitions, strong demand in rental housing, and exposure to international markets, CAPREIT is well-positioned for continued performance amid a tight housing market and rising rental rates.

Potential Risks: From Strong Rents to Squeezed Margins

While CAPREIT remains a top residential REIT, it faces mounting headwinds from rising costs, regulatory risk, and economic uncertainty.

Same-property NOI growth slowed to 3.4% in Q4 2024, as maintenance and repair expenses climbed. A potential shift in Canadian immigration policy could weaken rental demand, while high interest rates continue to pressure REIT valuations and acquisition strategies.

CAPREIT also competes with other major residential REITs and faces new risks through its European exposure, including currency volatility and unfamiliar regulatory landscapes.

Future performance will depend on its ability to maintain occupancy, control costs, and adapt to a changing macro environment.

Each REIT has strengths — whether it’s Granite’s industrial edge, CT’s retail consistency, or CAPREIT’s rental growth. Consider what fits your income goals and risk comfort.

Those REITs are great, but there’s more!

Monthly REITs are a powerful tool — but they’re not the whole picture. Relying solely on high yields can be risky, especially if payouts get slashed.

That’s why we built ‘Dividend Income for Life’ — a strategy that balances immediate income with long-term stability.

Discover the Dividend Strategy Built for Real, Long-Term Income

If you’re counting on monthly distributions to fund your retirement, there’s something you need to know: many of them aren’t sustainable. High yields can vanish overnight with a dividend cut — leaving your income and peace of mind at risk.

That’s where Dividend Income for Life comes in.

This free guide reveals a disciplined, proven strategy to build income from dividend stocks that grow over time — not just pay today.

Inside, you’ll learn:

✅ Why monthly income funds can be misleading (and what to use instead)
✅ The secret power of low-yield, high-growth stocks to protect your income
✅ How to build a portfolio that grows your cash flow and preserves your capital
✅ Real data: how dividend growers crushed high-yield stocks over the last decade
✅ A smarter withdrawal approach to make your money last

🛡️ Don’t trade short-term comfort for long-term risk.
Build a dividend income stream designed to last – and grow – for life.

👉 Download your free copy now and take control of your retirement income.

Canadian Banks Ranking 2025

Think all Canadian banks are the same? Think again.

Your choice could mean the difference between market-beating returns and lagging.

A common belief is that all Canadian banks perform similarly because of the country’s strong banking system. Since the 2008 financial crisis, each member of the Big Six (Royal Bank, TD Bank, ScotiaBank, BMO, CIBC, and National Bank) has taken a different path.

They all benefited from the banking oligopoly in Canada to fund new growth vectors. Fifteen years later, picking the wrong bank will leave much money on the table.

While most have outperformed the Canadian stock market for 5, 10, 15, and probably 25 years, as of March 2025, five of six had outperformed the market, and four also outperformed the ZEB.TO equal weight banks ETF over 10 years.

10-yr Total Return Canadian Banks vs market and banks ETF.

In other words, two are lagging. So which one is best this year and for decades to come?

Canadian Banks Ranking 2025

#6 ScotiaBank (BNS.TO)

Investment Thesis: International Edge – A Double-Edged Sword

Scotiabank differentiates itself from Canada’s Big Six banks with its extensive international presence, particularly in Latin America. While this provides higher long-term growth potential, it also introduces volatility and risk.

The bank has streamlined its global footprint, focusing on key markets like Mexico, Peru, and Chile. However, it has consistently struggled to outperform its peers.

Growth will depend on optimizing international operations, expanding wealth management, and navigating economic challenges. While Scotiabank benefits from Canada’s highly regulated banking system, its international moat is narrower than competitors, limiting its pricing power abroad.

BNS.TO 10-year Dividend Triangle.

Potential Risks: Volatility Ahead

BNS’s international presence brings unique risks, including exposure to economic downturns, political instability, and currency fluctuations.

The bank has faced rising provisions for credit losses (PCLs), an inefficient cost structure, and challenges in improving profitability.

Domestically, Scotiabank remains vulnerable to a housing market correction and economic slowdown. Broader macroeconomic risks, such as rising interest rates and trade tensions, add further uncertainty. Despite its international reach, Scotiabank has struggled to achieve superior financial performance compared to its peers, lacking dominant market share in key regions and facing stiff competition in wealth management.

The ONLY List Using the Dividend Triangle

After this first example, you may wonder how I was able to differentiate these positions.

I analyze companies according to their dividend triangle (revenue, earnings, and dividend growth trends), combined with their business model and growth vectors. While this may seem too simple, two decades of investing have shown me it is reliable.

Red star.

While many seasoned investors also use these metrics in their analysis, no one has created a list based on them before. This is exactly why I created The Dividend Rock Stars List.

The Rock Stars List isn’t just about yield—it’s built using a multi-step screening process to ensure the highest-quality dividend stocks. You can read more about it or enter your name and email below to get the instant download in your mailbox.

#5 Canadian Imperial Bank of Commerce – CIBC (CM.TO)

Investment Thesis: A Safe Bet or a Slow Grower?

CIBC shows a strong focus on domestic retail and commercial banking.

Unlike peers with extensive international exposure, CIBC has pursued U.S. expansion to diversify its revenue streams, particularly in wealth management. However, integrating private banking remains a challenge.

The bank trades at a discount due to its slower growth trajectory, making it appealing to income-focused investors.

Its digital banking platform, Simplii Financial, presents an opportunity for long-term customer retention, while reliance on mortgage lending poses risks in economic downturns. While benefiting from Canada’s banking oligopoly, CIBC lacks the competitive moat of more diversified peers.

CM.TO 10-year Dividend Triangle.

Potential Risks: Too Focused on Canada?

CIBC faces significant risks due to its heavy reliance on the Canadian housing market, making it more vulnerable than its peers to rising interest rates and a potential real estate downturn.

The bank’s high exposure to uninsured mortgages could increase loan loss provisions in an economic slowdown. Its domestic concentration further exposes it to Canadian economic cycles, regulatory changes, and potential recessions.

Among the Big Five, CIBC has underperformed in total returns and future growth expectations, with its strong dividend yield coming at the cost of lower capital appreciation. While its U.S. expansion aims to diversify risk, its mortgage-heavy model remains a key weakness.

#4 TD Bank (TD.TO)

Investment Thesis: Canada’s Most American Bank

Toronto-Dominion Bank (TD) stands out due to its strong retail banking franchise and significant U.S. presence.

With the largest branch network of any Canadian bank in the U.S., TD has historically relied on acquisitions and organic expansion for growth. However, recent regulatory scrutiny and an anti-money laundering investigation in the U.S. have limited its expansion opportunities.

While TD benefits from a stable Canadian business, rising interest rates present both an opportunity for higher margins and a risk of loan defaults.

TD.TO 10-year Dividend Triangle.

Potential Risks: Can TD Overcome Its U.S. Setback?

TD Bank faces mounting risks due to its U.S. anti-money laundering investigation, which led to a multibillion-dollar fine and asset growth restrictions on its U.S. operations.

This directly impacts TD’s long-term expansion strategy, forcing it to shift focus from aggressive growth to regulatory compliance and operational efficiency.

The bank also remains exposed to the Canadian housing market, where rising interest rates could increase mortgage defaults. Broader economic risks add further uncertainty, including trade tariffs and slowing growth.

While TD’s strong brand and market position remain advantages, regulatory constraints could allow competitors to expand more aggressively, putting TD at a disadvantage.

#3 Bank of Montreal – BMO (BMO.TO)

Investment Thesis: Capital Markets, Wealth Management & U.S. Banking

BMO is a diversified financial institution with a strong presence in Canada and the U.S., generating about one-third of its revenue from U.S. operations.

Its strategic expansion, particularly through the 2023 acquisition of Bank of the West, strengthens its cross-border footprint.

BMO has also been a leader in wealth management and ETFs, leveraging these segments for stable fee-based revenue. However, rising provisions for credit losses (PCLs), integration challenges, and exposure to capital markets introduce volatility to its earnings.

BMO.TO 10-year Dividend Triangle.

Potential Risks: Can It Manage Rising Risks While Competing with Industry Giants?

BMO’s reliance on wealth management and capital markets for growth exposes it to heightened risk, particularly during periods of economic uncertainty.

Rising provisions for credit losses (PCLs) have significantly impacted earnings, partly driven by the challenges of integrating its Bank of the West acquisition.

The bank faces competitive pressures in traditional banking and the ETF space, where BlackRock (BLK) remains a dominant force.

Additionally, macroeconomic headwinds—including trade tensions and potential recession risks—could lead to earnings volatility. While BMO’s U.S. expansion provides diversification, it also increases exposure to higher credit risks compared to more domestically focused Canadian banks.

#2 National Bank (NA.TO)

Investment Thesis: Western Expansion and Global Investments

NA is the most domestically focused of the Big Six banks, with 73% of its revenue generated in Canada, primarily in Quebec.

Its recent $5B acquisition of Canadian Western Bank is set to expand its presence in Western Canada, creating cross-selling opportunities, particularly in private banking.

The bank has also diversified beyond traditional banking, with significant growth in capital markets, wealth management, and international investments, including ABA Bank in Cambodia and Credigy in the U.S.

NA.TO 10-year Dividend Triangle.

Potential Risks: Growing Challenges

National Bank’s strong performance comes with significant risks, primarily due to its heavy reliance on Quebec, which accounts for about 50% of its revenue. This geographic concentration makes it more vulnerable to regional economic downturns than its larger, more diversified peers.

This also explains why it has fallen second this year, considering the economic uncertainty linked to political tensions between Canada and the U.S.

The bank also takes on higher risk through its international investments in Cambodia (ABA Bank) and alternative lending in the U.S. Rising provisions for credit losses, particularly from ABA Bank, add further uncertainty.

Additionally, its exposure to financial markets introduces earnings volatility, while its smaller scale puts it at a competitive disadvantage against Canada’s largest banks.

I discussed NA’s current challenges in more depth in the Q1-2025 earnings review video. You can then fully grasp why it now holds the second position while remaining one of the best banks for investors.

#1 Royal Bank – RBC (RY.TO)

Investment Thesis: Built for Global Growth

RBC is the largest Canadian bank by market capitalization, with a well-diversified revenue model spanning personal and commercial banking, wealth management, insurance, and capital markets.

Over 50% of its revenue now comes from insurance, wealth management, and capital markets, reducing dependence on traditional banking. RBC’s focus on expanding these segments post-2008 has positioned it well for stable cash flows, market-driven profitability, and global growth.

While Canadian banking regulations create high barriers to entry, RBC’s strong international presence enhances its resilience. Its brand strength, extensive client base, and broad service offerings make it a dominant force in the financial sector.

RY.TO 10-year Dividend Triangle.

Potential Risks: Housing, Regulation, and Market Volatility

Despite its diversified business model, RBC faces key risks, including exposure to the Canadian housing market, regulatory constraints, and economic downturns, just like any other bank.

Rising interest rates could increase mortgage defaults, impacting its loan portfolio and necessitating higher provisions for credit losses (PCLs).

A potential recession could slow lending activity and increase default rates in both personal and commercial banking. Additionally, regulatory changes could limit profitability, while competition from both domestic banks and global financial institutions pressures RBC to innovate and adapt continuously.

All things considered, it remains the best Canadian Bank option for dividend growth investors.

Find Other High-Quality Stocks: Download the Dividend Rock Stars List

This dividend stock list is updated monthly. You will receive the updated version every month by subscribing to our newsletter. You can download the list by entering your email below.

This isn’t just a list of high-yield stocks—it’s a handpicked selection of Canada’s best dividend growth stocks backed by detailed financial analysis.

✅ Monthly updates
✅ Full dividend safety ratings
✅ 10+ Metrics with filters

Enter your email to get the latest Canadian Dividend Rock Stars List now!

Final Thoughts: Don’t Overdo It!

I’m a foodie, and I love cooking. I particularly like adding spices to get the right taste in a good recipe.

But one thing I don’t do when I cook is to open my cabinet and select sea salt, pink salt, lava salt, Kosher salt, Celtic salt, smoked salt, and a pinch of Fleur de Sel all for the same recipe.

You probably know why, as the taste would very likely be disgusting.

Like seasoning in a meal, a little exposure to Canadian banks can enhance your portfolio. But overdoing it? That could leave a bad aftertaste. Choose wisely.

Buy and Hold Forever: Top Canadian Stocks for Lifetime Returns

What if you could invest once and never worry again?

That’s the power of forever stocks—companies so strong and reliable that you can buy them, hold them for decades, and sleep soundly at night.

Let’s be clear, my selections aren’t based on timing; I’m not saying that they are great buys right now, but rather that I’d buy any of them and that, if I couldn’t monitor them quarterly as I do (and you should too), I wouldn’t worry much.

Forever stocks share several of these qualities:

  • Diversification
    • Forever stocks are companies that diversify to reduce risk by not relying solely on one market or product for revenue.
  • Market leaders
    • Forever stock companies often dominate their industry or market segment, enjoying a significant market share and strong competitive advantages.
  • Economies of scale
    • The average cost per unit decreases as a company produces more products or services.
  • Predictable cash flow
    • Being able to anticipate consistent and steady incoming cash over time reasonably is crucial for a company’s financial health and sustainability.
  • Stable or sticky business model
    • A stable business operates consistently and predictably; it found a formula for generating revenue and maintaining profitability.
    • A sticky business, on the other hand, aims for customer loyalty and retention, and repeat business.
  • Essential products or services
    • Selling essentials—food, medical supplies, energy, communication services, transportation, etc.— produces relatively stable demand and revenue stream, as well as repeat business due to customer loyalty and resilience.
  • Multiple growth vectors
    • Growth vectors are paths to expand business, increase revenue, and enhance market presence.
  • Long dividend growth history
    • Yearly increases over decades mean the company ticks the boxes for many of the qualities described earlier.

This list is partial; clearly, other contenders could be on it. I have covered this part more in-depth on The Dividend Guy Blog.

Brookfield Corporation (BN.TO) – Financials

Brookfield skyrocketed with more than 50% return in 2024. I think there is more to come!

Brookfield is amongst the most prominent players in alternative asset management. As the stock market looks overvalued, many investors will turn toward alternative assets to generate profits and hedge their bets. Those long-term assets require patient capital and a high level of expertise. Brookfield is in a perfect position to provide this service to investors.

Even better, BN invests its capital in its many projects. Therefore, it can double-dip by charging a fee on managed capital and making capital gains when selling assets.

The ONLY List Using the Dividend Triangle

After this first example, you may wonder how I find such high-quality dividend stocks.

I handpick companies with a strong dividend triangle (revenue, earnings, and dividend growth trends) and make sure I understand their business model. While this may seem too simple, two decades of investing have shown me it is reliable.

Red star.

While many seasoned investors also use these metrics in their analysis, no one has created a list based on them before. This is exactly why I created The Dividend Rock Stars List.

The Rock Stars List isn’t just about yield—it’s built using a multi-step screening process to ensure the highest-quality dividend stocks. You can read more about it or enter your name and email below to get the instant download in your mailbox.

National Bank (NA.TO) – Financials

The bank seems to have done everything right over the past 15 years.

This significant transformation converted a small provincial bank into a serious player in capital markets and the private wealth industries.

The Bank is expected to complete a key acquisition of Canadian Western Bank in 2025, which will bring more capital onto its balance sheet (supporting capital market lucrative operations), more synergies (high cross-selling opportunities between CWB’s commercial clients and private wealth management), and a good presence in Western Canada.

NA is also doing very well in Cambodia (Aba Bank) and through its door into the U.S. (Credigy).

Note that National Bank (NA.TO) is also a Canadian Dividend Aristocrat.

Dollarama (DOL.TO) – Consumer Discretionary

DOL has built a strong brand, and its business model (aimed at low-value items) is an excellent defensive play against the e-commerce threat over the retail business.

As consumers’ budgets are tight, DOL appears to be a fantastic alternative for many goods. Dollarama has consistently increased same-store sales and opened new stores.

Introducing many products under its “home brand” increases the company’s margin. DOL introduced a new price point of $5 for many items, adding flexibility and pricing power.

DOL.TO 10-year dividend triangle: Revenue, EPS, and Dividend Growth.

Alimentation Couche-Tard (ATD.TO) – Consumer Staples

I’ve looked at grocery stores, but they don’t seem to offer many growth opportunities. Don’t get me wrong, they are great companies, but I think ATD will do better.

Things are changing quickly around the 7-Eleven deal. ATD has tried to get to the negotiation table to acquire 7-Eleven for a few months. The Japanese company is trying all means to stay Japanese. The latest chatter was that the son’s founder would repurchase it and make it private. The market liked the idea, and the ATD share price rose again. This story isn’t over yet, one way or another.

For 2025, I see ATD striking another acquisition.

After all, it’s in its DNA. If it’s not 7-Eleven, it will be another chain (maybe Casey’s?… it tried to acquire CASY in 2010). ATD must gain more expertise in growing organically through the sale of ready-to-eat and fresh produce. This is how they can mitigate the impact of slowing fuel and tobacco sales over the next 10-20 years.

Alimentation Couche-Tard (ATD.TO) is another Canadian Dividend Aristocrat part of this list.

Canadian Natural Resources (CNQ.TO) – Energy

CNQ is a rare beast in its environment that has increased dividends for 25 consecutive years. Yes, it even increased its payouts while everybody was on hold or cutting distributions in 2020.

This raises the question: Why is CNQ “oil price resistant”?

The company is sitting on a large reserve of cheap oil. According to management, CNQ is profitable, with an oil price per barrel of around $35-$40. This enables the company to manage production and capex with greater flexibility. They can then slow down CAPEX when the oil price is low and produce less. When we are in “full oil bull mode”, CNQ bolsters CAPEX and boosts production generating maximum cash flow. This is precisely what just happened when CNQ dropped its debt and now focuses on rewarding shareholders with share buybacks and dividend increases.

To be clear, I don’t see CNQ as a super-powered growth stock for the future. However, with a yield above 4% and a resilient business model, that’s the type of business that will either be very good in your portfolio or will go back into hibernation mode, paying a secure dividend. In both scenarios, you can be a winner in the long run.

Waste Connections (WCN.TO) – Industrials

If you are looking for a beast in the industrial sector, you should probably look toward the waste management industry.

Waste Connections has refined its expertise in acquiring and integrating smaller players in the same industry. Its business model is recession-proof, as solid waste is a given regardless of the economic cycle.

I also like the fact that WCN offers a recurring service and is fully integrated. Management has been adept at integrating their acquired companies. Therefore, the business is not only growing but also becoming more profitable.

The company has the size to enjoy the resulting economies of scale. Its dividend payment is low, but its dividend growth is strong.

WCN.TO 10-year dividend triangle: Revenue, EPS, and Dividend Growth.
DOL.TO 10-year dividend triangle: Revenue, EPS, and Dividend Growth.

CCL Industries (CCL.B.TO) – Materials

Finding an international leader with a well-diversified business based in Canada is rare.

Through the significant acquisition of business units from Avery (the world’s largest supplier of labels) in 2013, the company has set the tone for several years of growth. Bolstered by its previous successes, CCL also bought Checkpoint, a leading developer of RF and RFID, and Innovia in the past few years and announced more acquisitions in 2021.

The company can still generate organic growth (roughly 4-5%) on top of its growth through acquisitions.

Granite (GRT.UN.TO) – Real Estate

Granite is a very frustrating REIT to hold.

I love the investment thesis, which includes the strong need for industrial properties, GRT’s ability to grow its business while growing FFO per unit and distribution increases intact, and the high occupancy rate. The financial metrics back this investment thesis, such as revenue, funds from operations, FFO per unit, payout ratio, and occupancy rate, all look good.

Why is GRT frustrating to hold?

Because it simply doesn’t get any love from the market. Despite its good numbers, GRT lags the market and fails to generate positive returns. This is among the rare REITs exhibiting AFFO per unit growth while issuing more units to finance growth.

Fortis (FTS.TO) – Utilities

Fortis invested aggressively over the past few years, resulting in solid growth from its core business.

Investors can expect FTS’ revenues to grow as it expands. Bolstered by its Canadian-based businesses, the company has generated sustainable cash flows, leading to four decades of dividend payments.

The company’s five-year capital investment plan is approximately $25 billion between 2024 and 2028, $2.7 billion higher than the previous five-year plan. The increase is driven by organic growth, reflecting regional transmission projects for several business segments. Only 33% of its CAPEX plan will be financed through debt, while 61% will come from cash from operations. Chances are that most of its acquisitions will happen in the U.S.

We also like the company’s goal of increasing its exposure to renewable energy from 2% of its assets in 2019 to 7% in 2035.

FTS.TO 10-year dividend triangle: Revenue, EPS, and Dividend Growth.

Find Other Buy and Hold Forever Stocks: Download the Dividend Rock Stars List

This dividend stock list is updated monthly. You will receive the updated version every month by subscribing to our newsletter. You can download the list by entering your email below.

This isn’t just a list of high-yield stocks—it’s a handpicked selection of Canada’s best dividend growth stocks backed by detailed financial analysis.

✅ Monthly updates
✅ Full dividend safety ratings
✅ 10+ Metrics with filters

Enter your email to get the latest Canadian Dividend Rock Stars List now!

Canadian Dividend Rock Stars List

I used to think that dividend stocks with a yield lower than 3% were worthless. Two decades of investing proved me wrong!

The Canadian Rock Stars List is a selection of the safest dividend stocks in Canada, identified through a rigorous screening process.

Unlike traditional high-yield lists, this selection combines dividend growth, financial strength, and credit stability to determine the best long-term holdings for investors seeking both income and growth.

Dividend Growth Investing = Safe Investing, More Money, Less Stress

“When you have confidence, you can have a lot of fun. And when you have fun, you can do amazing things.”

~Joe Namath

My entire portfolio is invested in dividend growth stocks.

Some holdings act as fixed income, offering a stable dividend yield and being able to weather market storms. Some others are my growth equity, providing lower yields but strong dividend growth and stock price appreciation potential.

Combining various dividend growers will create a balance where your portfolio will help you retire stress-free.

Even Vanguard—a pioneer in ETF investing—conducted studies on recent market history and concluded that dividend growers are among the best-performing assets.

Performance of dividend-oriented equity stategies figure by Vanguard
Performance of dividend-oriented equity strategies figure by Vanguard.

According to Vanguard’s study over these 20 years, dividend growth stocks not only beat the market, but they did it with less volatility.

While dividend growers usually give investors less volatility, you will still go through challenging periods where your favorite holdings will show red numbers. This is where you may start losing confidence and wondering if it would be appropriate to cash your profits and protect your capital.

The Ultimate Safe List to Get Dividend Growth Stock Ideas

To help you build a solid portfolio with dividend growth stocks, I have created the Canadian Rock Stars List, showing about 300 companies with growing trends.

You can read on to understand how it is built and why it’s the ultimate list for Canadian dividend investors, or you can skip to the good stuff and enter your name and email below to get the instant download in your mailbox.

How Has the Canadian Rock Stars List been Built?

This Canadian dividend stocks list has been created with the help of our investment membership; Dividend Stocks Rock.  The market will keep throwing you curveballs, so let’s make sure you don’t whiff on them.

We have a clear strategy: we focus on dividend growth stocks.

We handpick companies showing a strong dividend triangle (revenue, earnings, and dividend growth trends) and make sure we understand their business model. Since our model is easy to understand and we know why we use it, we never doubt ourselves.

The Rock Stars List isn’t just about yield—it’s built using a multi-step screening process to ensure the highest-quality dividend stocks.

Here’s how we select the best Canadian dividend stocks:

  1. Revenue & Earnings Growth—Minimum 1% annualized growth over 5 years (adjusted for market cycles).
  2. Dividend Growth—Minimum 5% annual dividend growth over 5 years.
  3. Financial Strength—We use Refinitiv’s StarMine Credit Score to assess a company’s ability to handle debt and maintain dividends. It ranks a company’s 1-year default probability from 1-100, with higher scores indicating lower bankruptcy risk.
  4. Value Analysis—We integrate the StarMine Value Score and analyze six valuation metrics to avoid overpaying. It ranks stocks (1-100) based on their valuation, with higher scores indicating better value. It evaluates six key metrics: EV/Sales, EV/EBITDA, P/E, Price/Cash Flow, Price/Book, and Dividend Yield.
  5. ESG Considerations—The Refinitiv ESG Combined Score evaluates a company’s Environmental, Social, and Governance (ESG) performance, factoring in reported data and controversies. A higher score (1-100) indicates more substantial corporate responsibility, while legal or ethical issues can lower a company’s rating.

It’s a stronger list than the dividend aristocrats, as we combine various metrics on top of dividend growth.

By filtering the market to find Canadian stocks showing growing sales, earnings, and dividends, we are convinced we can pick among the best Canadian dividend stocks, period.

The Dividend Triangle is key to identifying safe Canadian stocks

With a smart combination of three metrics, you’ll be able to pick the best stocks from our list. You can quickly identify safe investments using the dividend triangle:

Revenues

A business is not a business without revenues.

What is the difference between a company with growing revenues versus a company showing stagnating results? Companies with several growth vectors will ensure consistent sales increases year after year. I’m a big believer in “offense is the best defense.” Whenever we are about to face a recession, I want to make sure I have companies that have shown past revenue growth.

This is an excellent indicator that their business model is doing well and that they won’t enter a recession in a position of weakness.

Dividend Triangle representation.

Earnings

You cannot pay dividends if you don’t earn money.

Then again, this is a straightforward statement. Still, if earnings don’t grow strongly, there is no point in thinking that the dividend payment will increase indefinitely. Keep in mind that the EPS is based on a GAAP calculation. This makes EPS imperfect, as accounting principles are not aligned with cash flow.

This means you are better off looking at the EPS trend over 3, 5, and 10 years. Use an adjusted EPS that discounts those one-time events revealed by the company to have a clear view of what is happening. Some companies could “play around” with earnings for a year or two, but you can’t create a trend out of thin air.

Dividends

Finally, dividend payments are the *obvious* backbone of any dividend growth investing strategy. But I don’t focus on the actual dollar amounts or the yields because we focus solely on dividend growth.

Dividend growers show confidence in their business model.

This is a statement claiming that the company has enough money to grow its business and reward shareholders simultaneously. It also tells you that the business can pay off its financial obligations and invest in new projects (CAPEX). No management team will increase its dividend if it lacks the cash to run its business.

The Dividend Rock Stars List: The ONLY List Using the Dividend Triangle

Red star.The dividend triangle is an exclusive concept developed at Dividend Stocks Rock (DSR).

While many seasoned investors use these metrics in their analysis, no one has created a list based on them before.

Don’t waste any more time with complex strategies and dozens of metrics duplicating each other: focus on quality and download the list with filters now.

What Does a Strong Dividend Triangle Look Like?

Putting those metrics into a stock screener is one thing, but knowing what to do with them is another.

The problem with a simple stock screener is that it will give me the 3-year or 5-year annualized growth, but I can’t see the trend.

A strong Dividend Triangle should show steady revenue, earnings, and dividend growth over time. The trend over the past five years for each metric is long enough to show the current tendency and highlight some jumps or drops I must investigate.

Below is an example of two dividend stocks:

🟢 Strong Dividend Triangle Example (National Bank of Canada – NA.TO)

  • Revenue: Consistent annual growth of 5%+
  • EPS: Follows revenue growth, ensuring profitability
  • Dividend Growth: Resumes steady increases after economic downturns

A decrease in earnings during the pandemic led to a pause (forced by regulators) in dividend growth. Now that the pandemic is behind us, National Bank is back on the Rock Stars list with a strong dividend growth potential.

NA.TO 5-year Dividend Triangle.

🔴 Weak Dividend Triangle Example (Algonquin Power & Utilities – AQN.TO)

  • Revenue: Inconsistent growth due to high debt and acquisitions
  • EPS: Declining due to rising borrowing costs
  • Dividend Growth: ❌ Cut after financial struggles in 2022 and again in 2024
AQN.TO 5-year Dividend Triangle.

Download the Exclusive Dividend Rock Stars List

This Canadian dividend stocks list is updated monthly. You will receive the updated version every month by subscribing to our newsletter. You can download the list by entering your email below.

This isn’t just a list of high-yield stocks—it’s a handpicked selection of Canada’s best dividend growth stocks, backed by detailed financial analysis.

✅ Monthly updates
✅ Full dividend safety ratings
✅ 10+ Metrics with filters

Enter your email to get the latest Canadian Dividend Rock Stars List now!

  • « Go to Previous Page
  • Page 1
  • Interim pages omitted …
  • Page 4
  • Page 5
  • Page 6
  • Page 7
  • Page 8
  • Interim pages omitted …
  • Page 15
  • Go to Next Page »

Copyright © 2025 · Moose Markets