Some companies scream “dividend grower” — stable revenue, rising earnings, mountains of cash flow — and yet, they barely pay a cent. One Canadian tech giant has delivered monster returns without ever becoming a traditional dividend payer. Instead of chasing yield and dividend payments, it reinvests cash into an aggressive, proven acquisition engine that keeps shareholders happy through capital gains, not distributions.
If you’re willing to make an exception for ultra-low yield in exchange for serious long-term wealth creation, this one might change how you define “dividend investing.”
Business Model: Buying, Holding, and Growing Software Niches
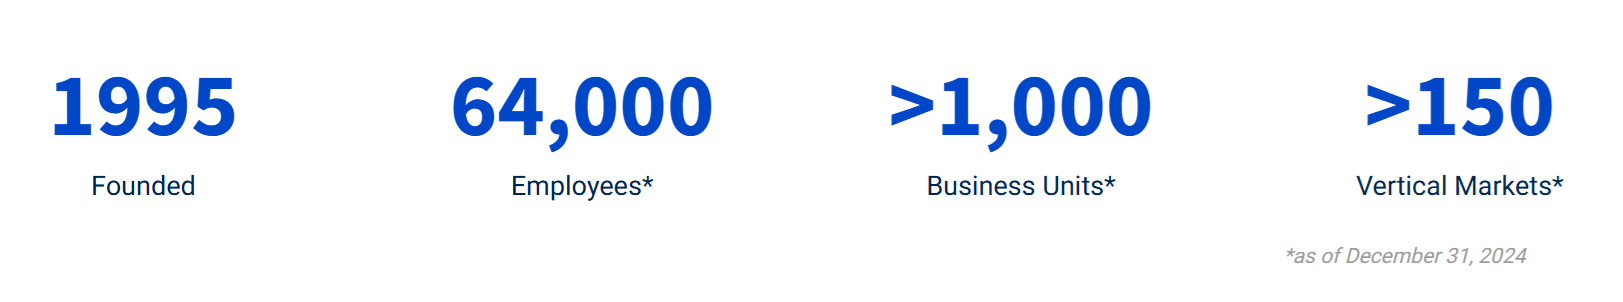
Constellation Software (CSU.TO) doesn’t build flashy apps or compete in crowded software categories. Instead, it acquires mission-critical software companies serving niche industries — often the kind of businesses no one’s ever heard of… except their loyal customers.
CSU acts like a holding company for vertical market software (VMS). It targets stable, low-churn software businesses with substantial recurring revenue, then lets them run independently with support from the parent. This decentralized model keeps local talent in place while improving capital discipline and operations.
Through six operating groups — Volaris, Harris, Topicus, Vela, Jonas, and Perseus — CSU now serves over 100 markets globally, spanning utility billing, health records, and marina management. The result? Low customer churn, sticky cash flows, and consistent margins — all without relying on a single industry.
Investment Thesis: Why Dividend Investors Should Still Care
At first glance, CSU doesn’t belong in a dividend portfolio. Its yield is barely noticeable, and it hasn’t raised its dividend in years. But dig deeper, and you’ll find a stock with all the hallmarks of a dividend growth engine — just without the dividend.
Revenue, EPS, and free cash flow all rise steadily thanks to one thing: disciplined acquisitions. CSU buys small, stable, and boring software companies at fair prices, then lets them thrive. Its decentralized playbook and capital discipline allow it to scale this model across dozens of verticals.
With low debt, high returns on capital, and a management team focused on long-term wealth creation, CSU continues to grow shareholder value — even if it keeps the cash in-house. For investors who prioritize compounding over current income, this is a name worth watching.
The Dividend Triangle in Action: Strong Fundamentals, Minimal Yield
Despite its low payout, CSU checks all three boxes of the Dividend Triangle:
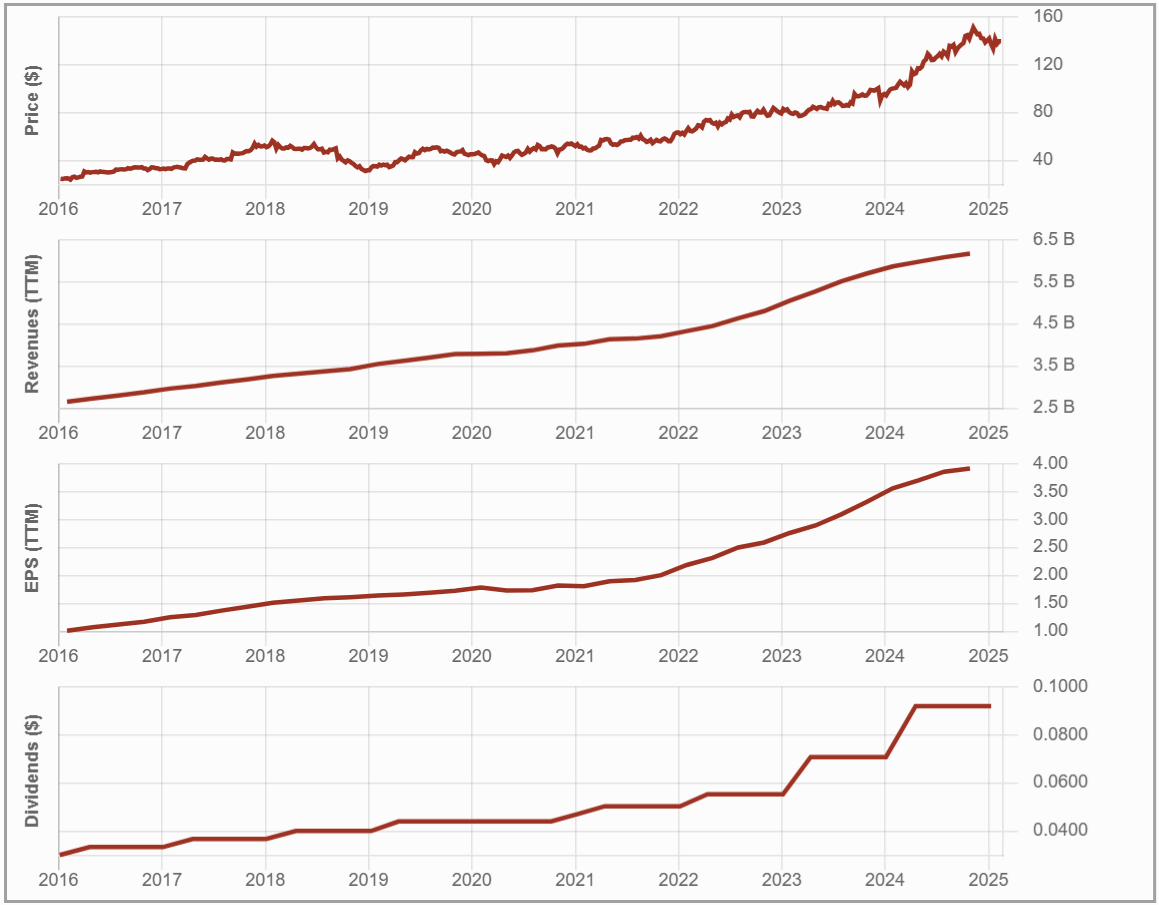
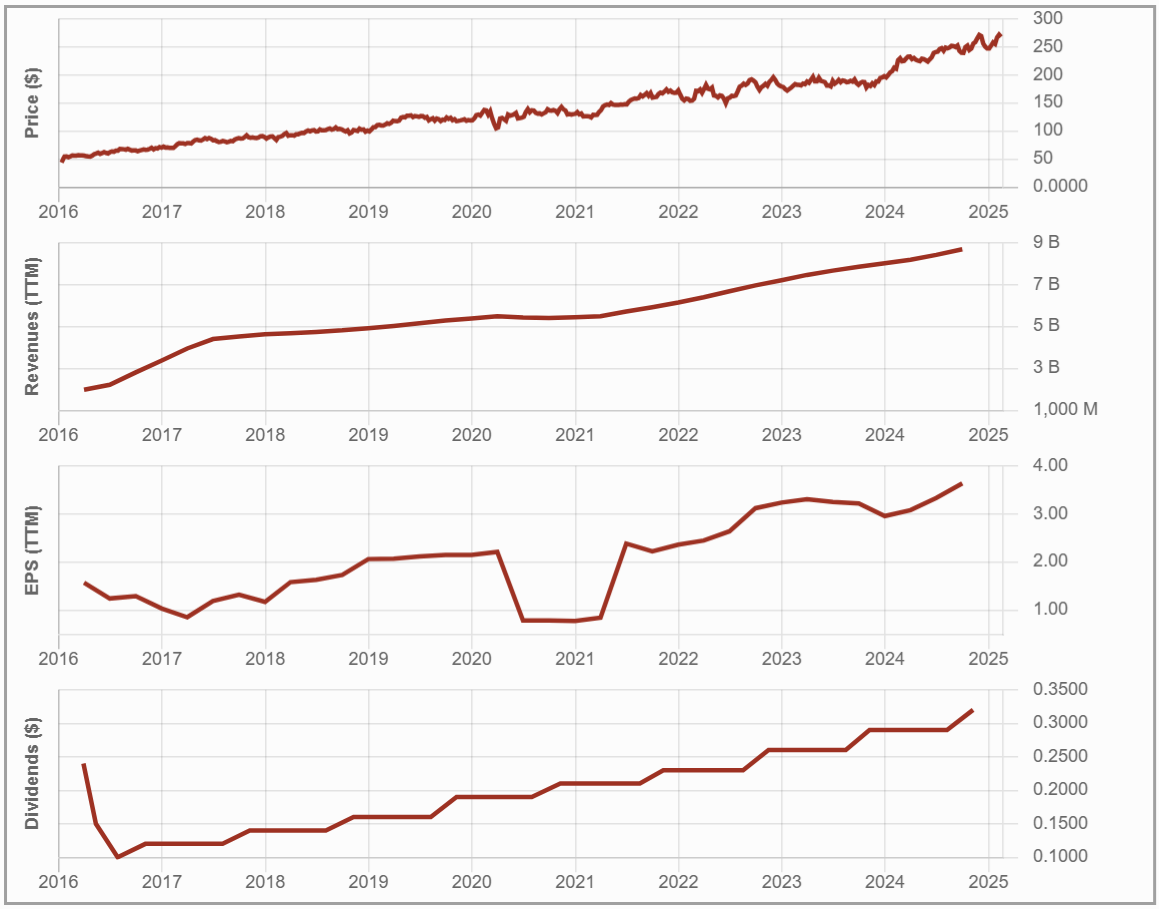
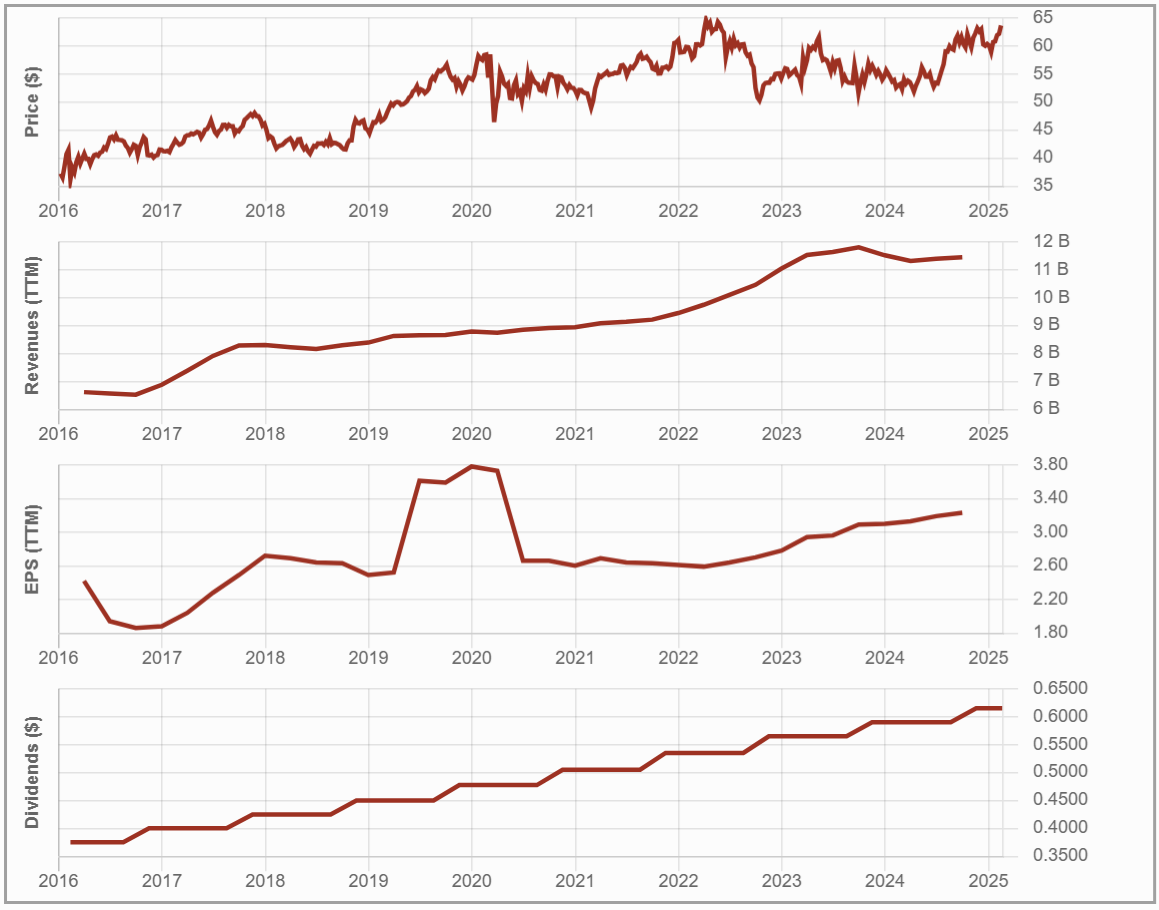
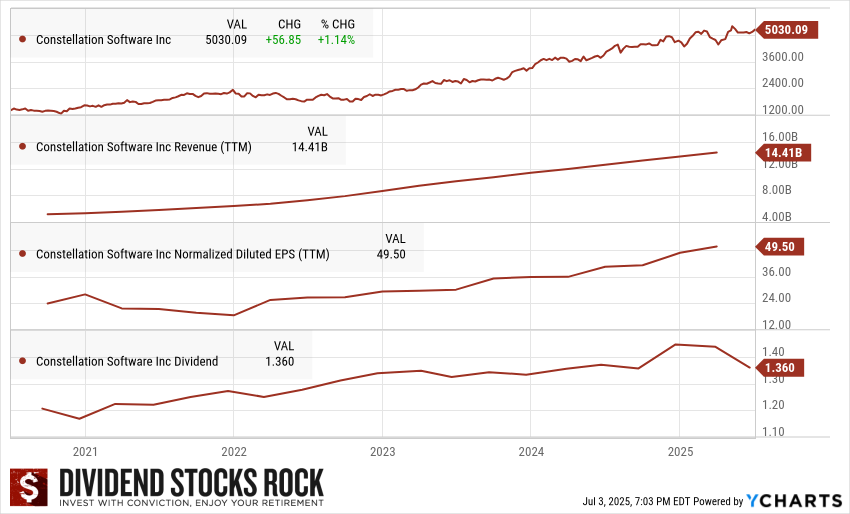
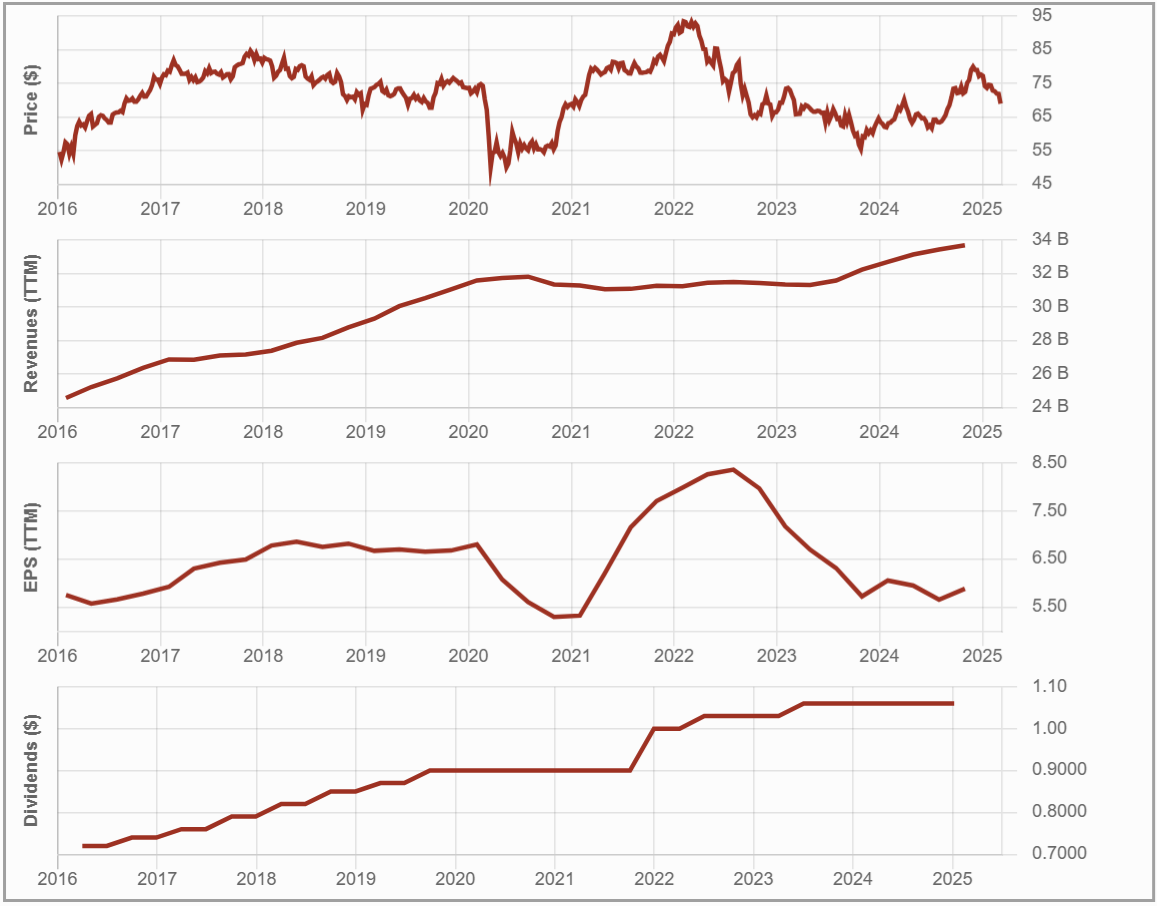
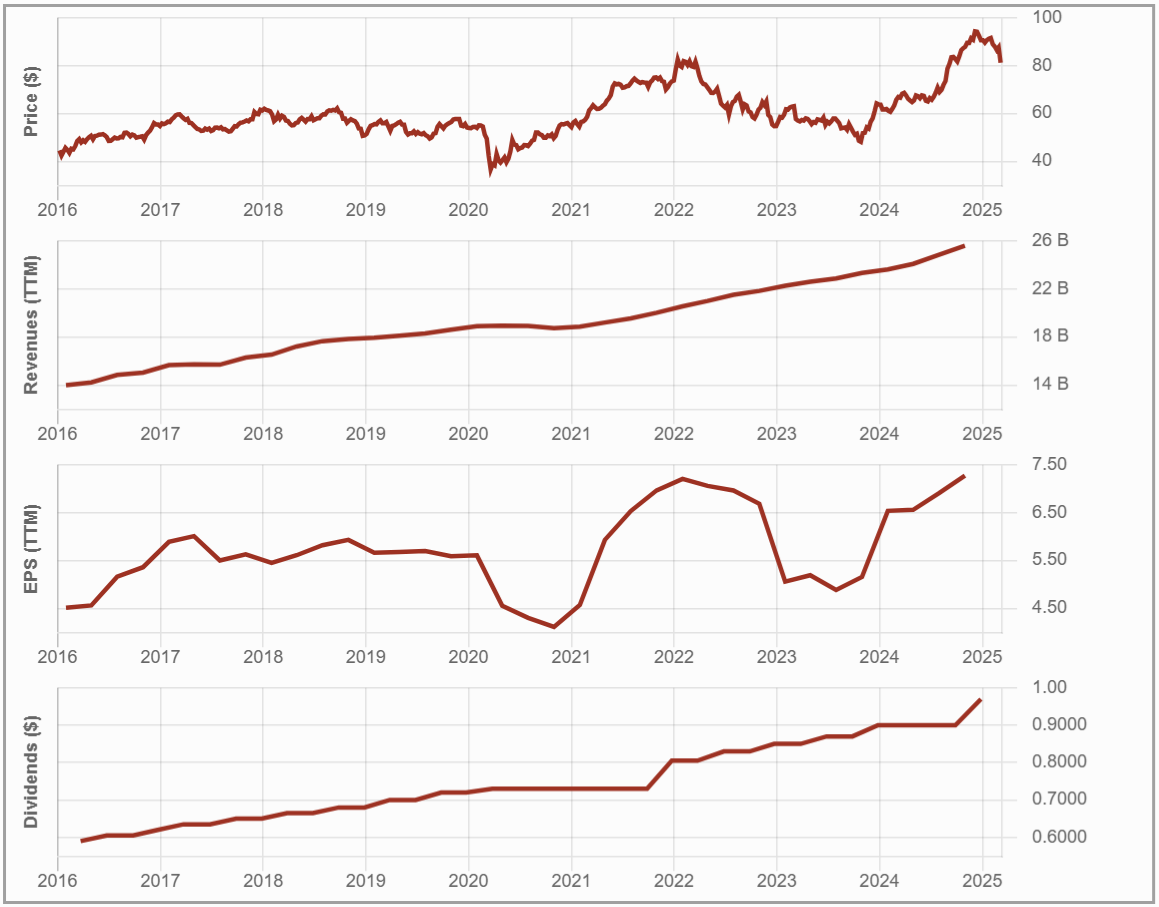
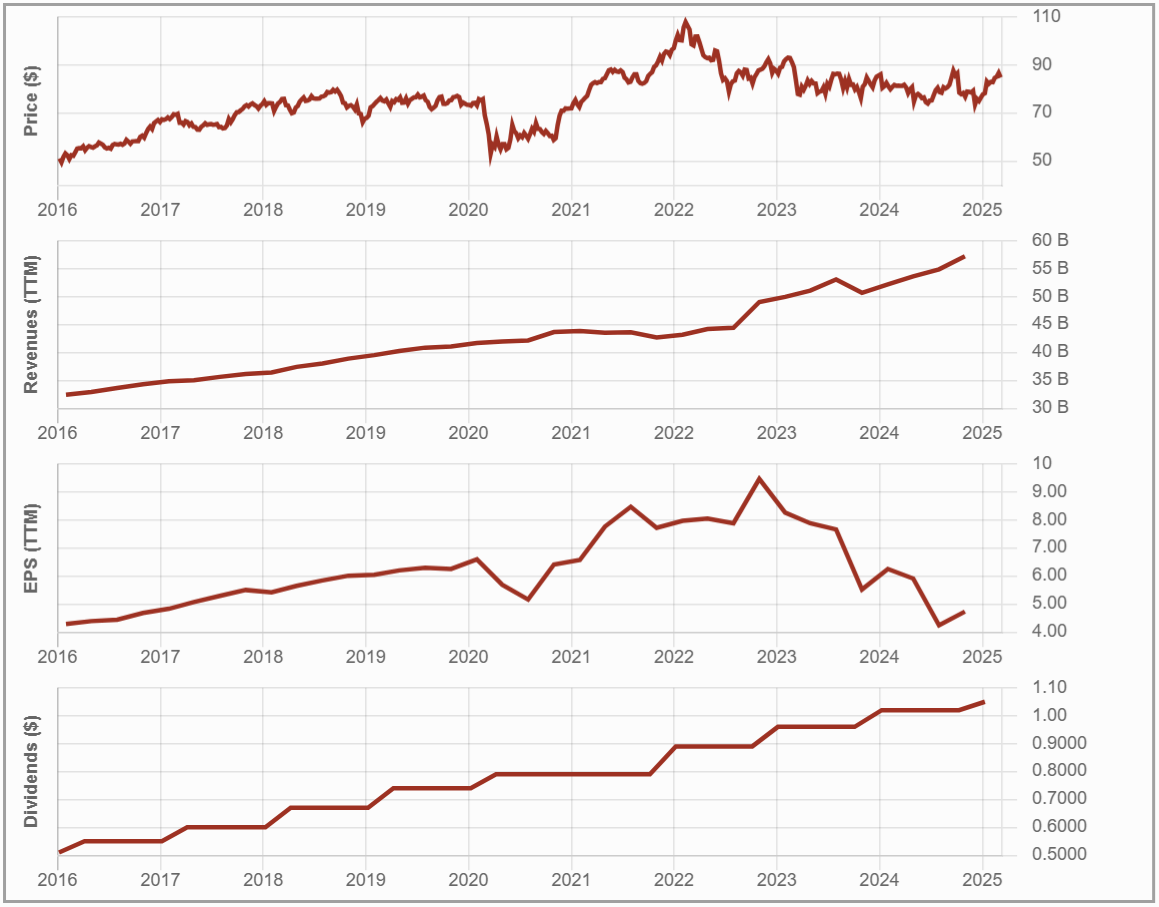
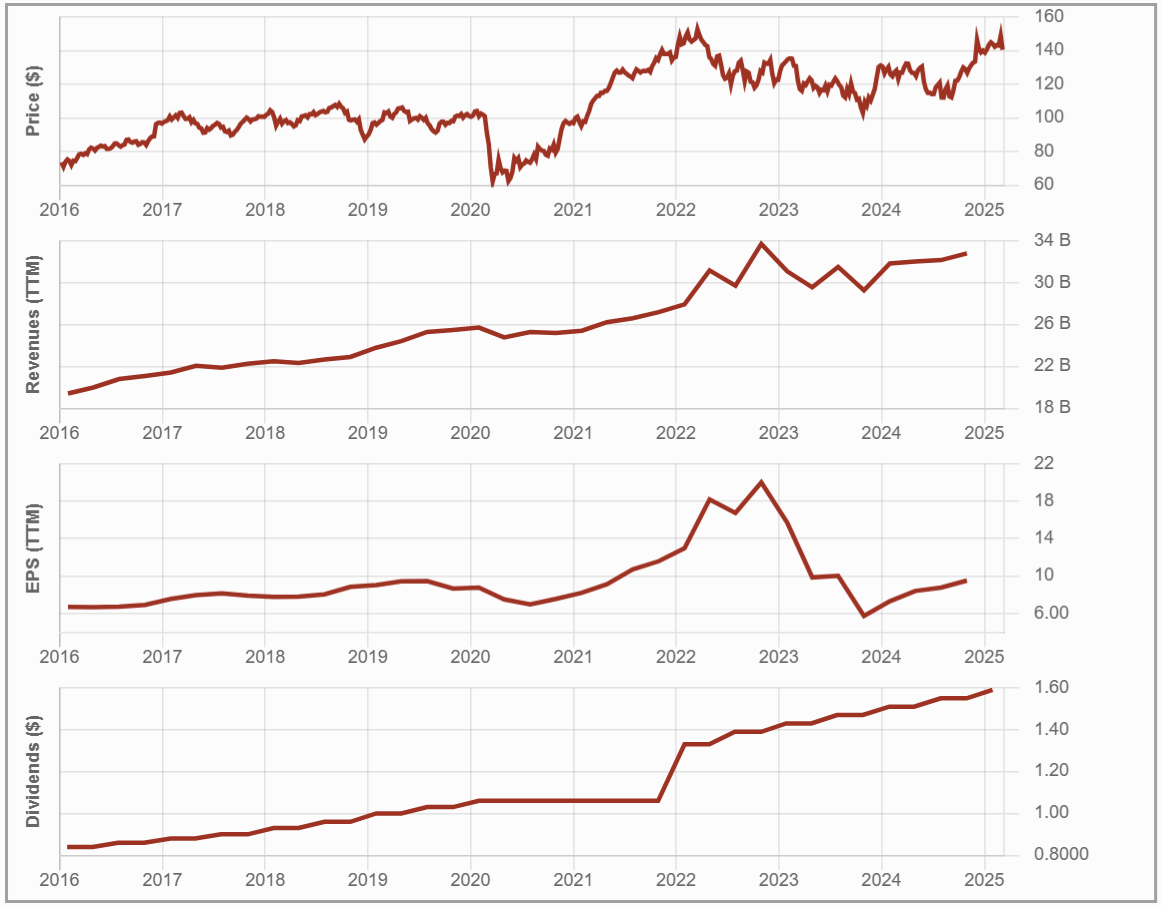
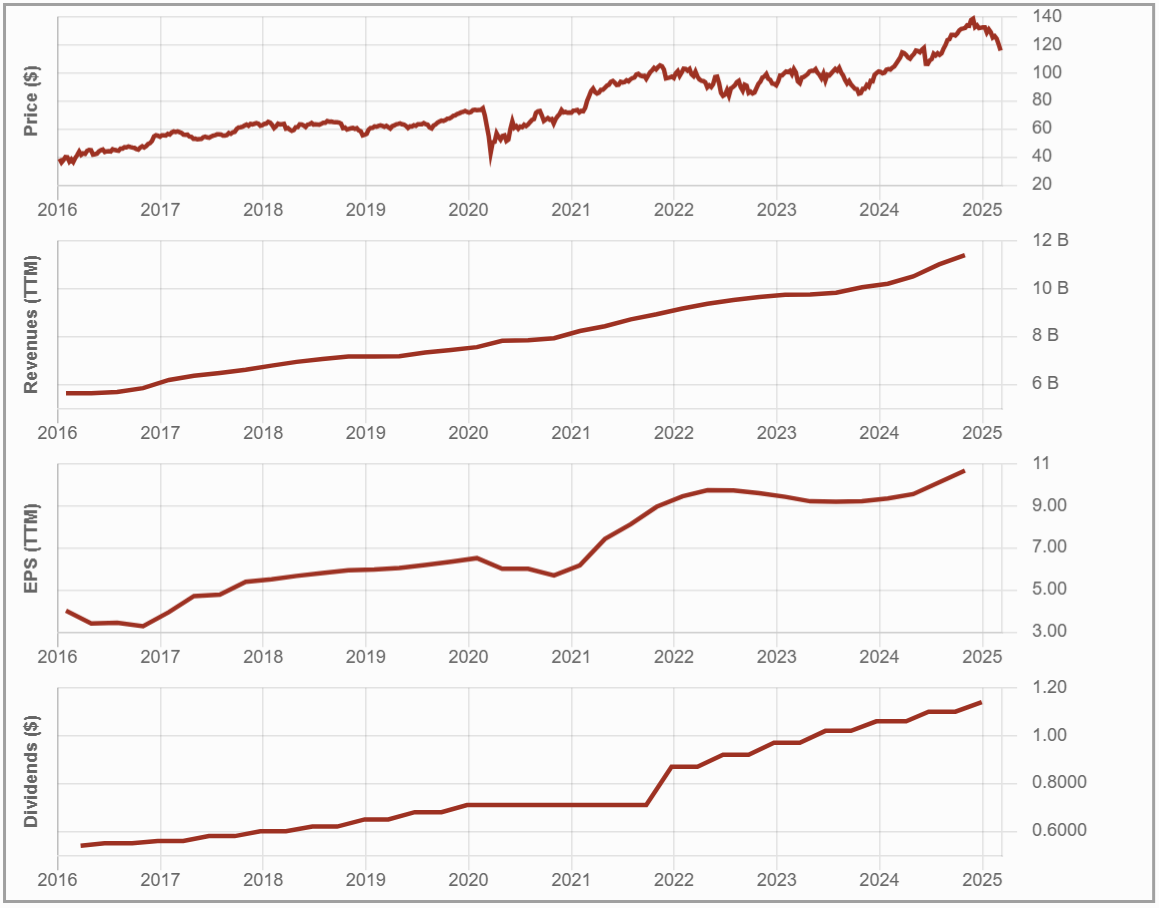
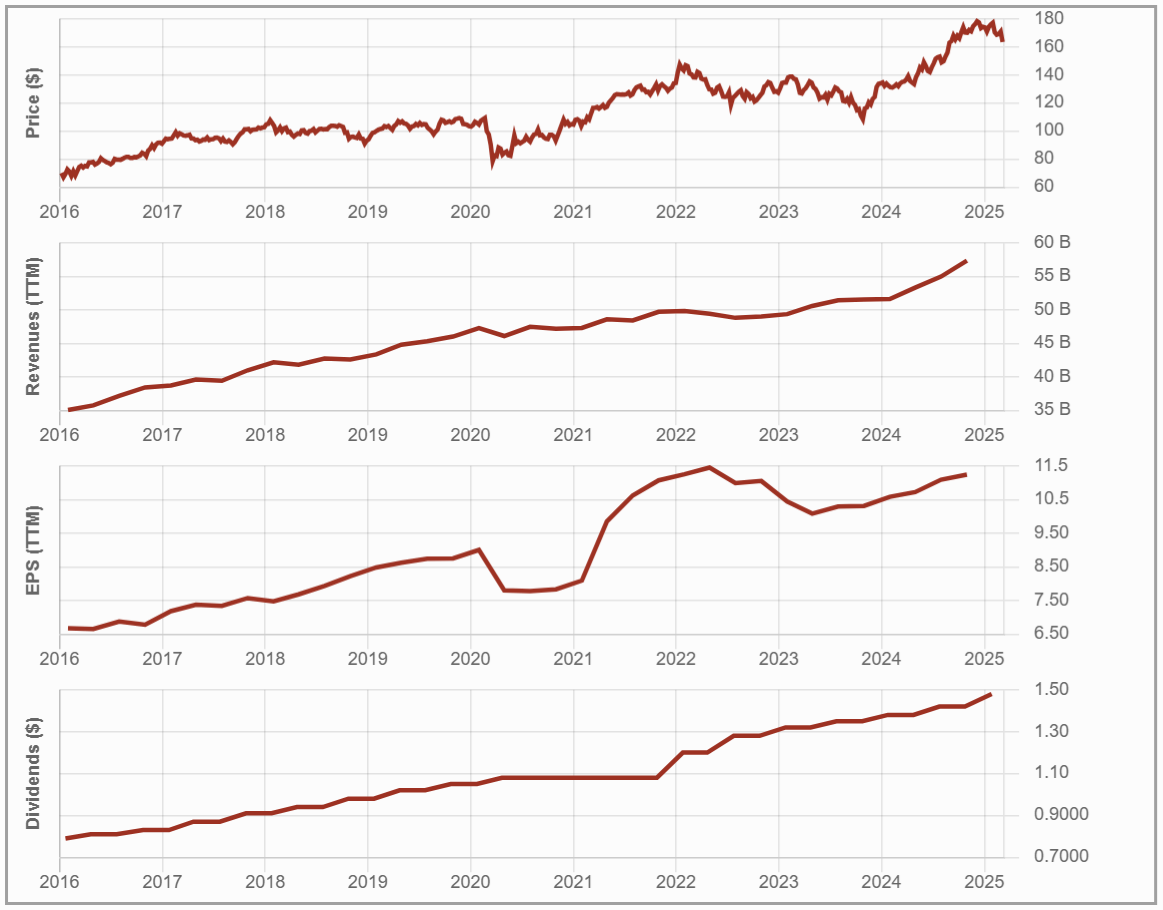
1. Revenue Growth: TTM revenue now sits at $14.41B, with a steady climb year after year. Q1 2025 revenue rose 13%, fueled by acquisitions and minor organic growth.
2. Earnings Growth: EPS reached $49.50, a 10% YoY increase. CSU continues to drive profit growth through smart integrations and operating efficiency.
3. Dividend Growth: This is where CSU “fails” the test. The dividend is stuck at $1.36, with no growth in sight — but that’s by design. With better uses for cash, management chooses to reinvest in new deals that generate higher long-term returns.
In short: this is a textbook Dividend Triangle stock — minus the dividend growth.
Bull Case: Serial Acquirer, Proven Playbook
For investors who don’t need yield today, CSU is a compounding machine with plenty to like:
-
Proven decentralized structure that scales across 100+ industries
-
Strong revenue, EPS, and cash flow growth — even in tough markets
-
Low debt, with $1.8B spent on acquisitions last year alone
-
Consistent history of finding, buying, and growing niche software companies
-
Organic growth may be small, but the acquisition pipeline is always full
Bear Case: All In on Acquisitions
Still, there are real risks to watch:
-
Growth depends on continuous deal flow. Slowdown = valuation hit
-
Acquisition multiples could rise as private equity and competitors enter the space
-
Complex structure makes it hard to track individual performance
-
Any stumble in capital allocation could rattle investor confidence
-
Sky-high valuation = little room for error
This stock is priced for execution. If the M&A engine stalls, so could the returns.
Latest News: Growth on Track, Expectations Higher
CSU’s most recent quarter showed solid results — but didn’t quite wow the market:
-
Revenue +13% | EPS +10%
-
Organic growth flat at 0.3% (2% with currency)
-
Free cash flow +14%
-
Acquired a significant stake in Asseco Poland S.A., expanding its global reach
Bottom line: growth continues, but with expectations so high, CSU needs to maintain a near-flawless execution pace.
Want More Stocks Like This?
We track more than yield. The Dividend Rock Star List includes Canadian and U.S. stocks that hit all the right metrics — even when yield is low.
Here’s what’s inside:
-
Filter by revenue, EPS, and dividend growth
-
Screen for quality with payout ratio, sector, and more
-
Updated monthly so you’re always working with fresh data
-
Great for building long-term portfolios focused on dividend resilience
Start browsing the Dividend Rock Star List now and find your next winner before everyone else does.
Final Word: All the Fundamentals, None of the Yield
Constellation Software isn’t for every dividend investor — and that’s okay. But if you’re willing to make a strategic exception, you’ll find a stock that does everything we want from a dividend grower… except pay one.
With decades of growth-by-acquisition success, low debt, high margins, and world-class capital allocation, CSU offers a blueprint for compounders. No fluff. No gimmicks. Just consistent, disciplined execution in a market that rewards it.
If you can live without the yield, this one might be worth the hold.

 What if you could invest once and never worry again?