Why look at the 5 most popular Canadian stocks with members of DSR Pro? To get ideas! You have your own process to select stocks, but seeing other investor’s favorites can open the door for new opportunities. It’s a great starting point for your research. I also do it out of curiosity 😉.
I surveyed the DSR database to pull out the 25 most popular Canadian and U.S. stocks, not looking at individual portfolios, but rather the number of times each stock appears across the 2,289 DSR PRO members’ portfolios. This is not based on value; I don’t know how much is invested in each stock.
This week, we have a fairly detailed look at the top 5 Canadian stocks, what I like and don’t like about each one and the roles they can play in a portfolio. We’ll see the remaining 20 in a later article.
5 U.S. stocks most popular with DSR Pro members
Never let a list like this replace your investment process. Don’t load up on these stocks without the conviction that they fit with your strategy. It’s a good list to start a research project, but that’s just the beginning. There’s more digging required before pulling the trigger…
TELUS (T.TO / TU)
1st place – 1451 members
Again, this year, Telus is the champ. It’s my favorite telecom. Most of its revenue comes from its wireless business. I like the wireless industry in Canada; there’s still organic growth potential and the development of 5G will enable additional growth vectors. I like how Telus diversified its business through artificial intelligence, healthcare, and agriculture, instead of going after more media business, Telus uses technology to catapult its business, which could be a hit or a miss.
![]() What’s not to like? DEBT! Telecoms rack-up debt faster than teenagers eat burgers! Right now, the narrative doesn’t fit with the numbers. For 10 years, Telus had a clear plan: get as much cheap debt as possible for investments (CAPEX) to fuel stronger generation of cash flows from operations. Ten years later, it’s time to show that stronger cash flow and smaller CAPEX. It’s improving, but not fast enough. I want to see Telus’s free cash flow cover the dividend payment. Management seems confident though; it raised the dividend again in November.
What’s not to like? DEBT! Telecoms rack-up debt faster than teenagers eat burgers! Right now, the narrative doesn’t fit with the numbers. For 10 years, Telus had a clear plan: get as much cheap debt as possible for investments (CAPEX) to fuel stronger generation of cash flows from operations. Ten years later, it’s time to show that stronger cash flow and smaller CAPEX. It’s improving, but not fast enough. I want to see Telus’s free cash flow cover the dividend payment. Management seems confident though; it raised the dividend again in November.
Telus pleases income-seeking investors with its generous yield, and also attracts growth investors with its technology growth segments. A great balance of growth and “sleep well at night” ingredients. A good fit for both “retirement” and “growth” portfolios. No wonder it’s one of the most popular Canadians stocks.
TD BANK (TD.TO / TD)
2nd place (up from 5th) – 1279 members
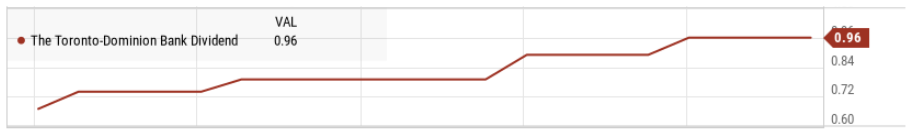
The largest Canadian bank in terms of assets, TD operates a classic business model mostly around savings & loans. Everybody likes Canadian banks, right? When you pick among the top 2 largest Canadian banks you can’t go wrong.
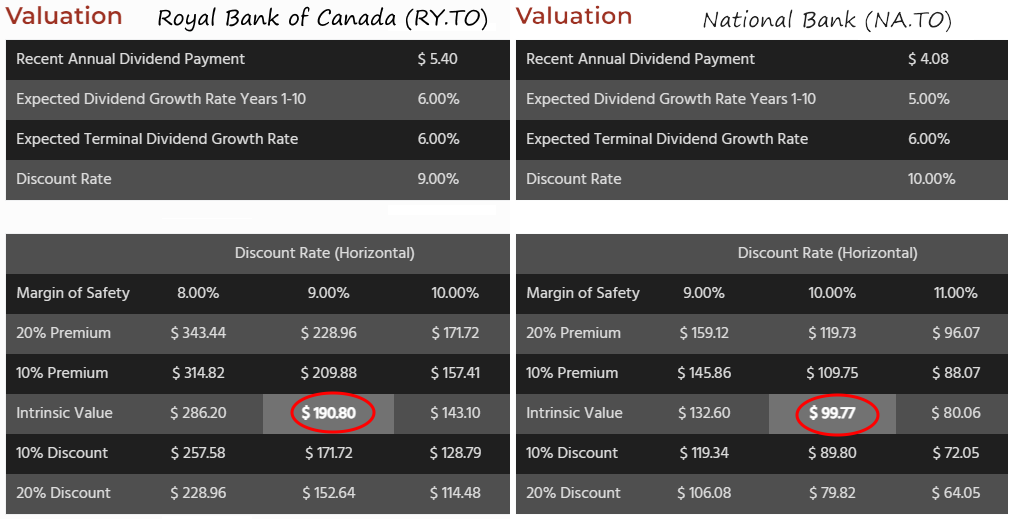
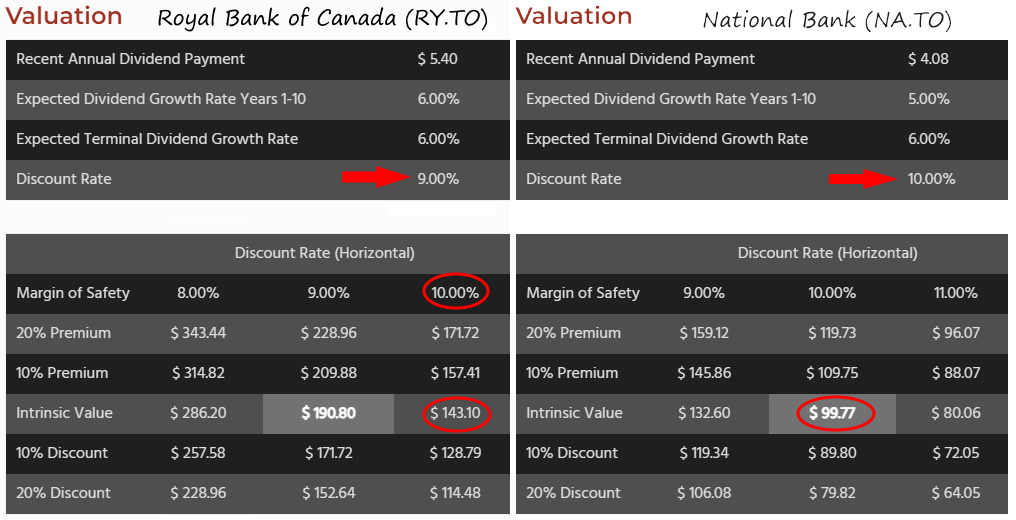
I like TD’s US exposure for additional growth (usually, the U.S. economy grows faster than the Canadian) and its 13.5% ownership of Charles Schwab (SCHW). I also appreciate TD’s focus on classic banking activities with some wealth management for good measure. Nothing eccentric. You can count on its solid balance sheet to keep up with its dividend growth policy.
![]() There isn’t much to dislike about TD. I rank it third behind Royal Bank and National Bank only because of its larger exposure to the loan market. A more classic bank, TD takes fewer risks in the stock market, but more for mortgages and commercial loans. With high interest rates and possibly a slowing economy, all eyes on its provisions for credit losses. While a great source of growth, TD’s presence in the U.S. can expose it to a more volatile economic environment. When it comes to banks, it’s the wild west in the U.S.
There isn’t much to dislike about TD. I rank it third behind Royal Bank and National Bank only because of its larger exposure to the loan market. A more classic bank, TD takes fewer risks in the stock market, but more for mortgages and commercial loans. With high interest rates and possibly a slowing economy, all eyes on its provisions for credit losses. While a great source of growth, TD’s presence in the U.S. can expose it to a more volatile economic environment. When it comes to banks, it’s the wild west in the U.S.
TD is another sleep-well-at-night stock. Interestingly, you’ll get a fair share of growth at the same time!
FORTIS (FTS.TO / FTS)
3rd place (up from 7th) – 1223 members
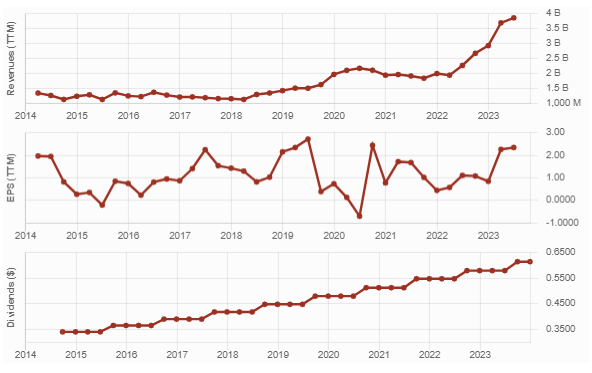
A big jump for Fortis, which fully merits a spot in the most popular Canadian stocks. I increased my position in this solid utility after the Algonquin debacle. Fortis is a classic utility offering transmission and distribution of electricity and natural gas to its customers. It’s virtually 100% regulated, leading to stability and predictable cash flow. This sustainable cash flow has resulted four decades of dividend payments!
![]() Fortis invested aggressively over the past few years resulting in strong growth from its core business. You can expect revenues to keep growing as expansion continues. I like its goal of increasing its exposure to renewable energy from 2% of its assets in 2019 to 7% in 2035. In its five-year capital investment plan of ~$20B up to 2026, only 33% is financed through debt, while 61% comes from cash from their own operations.
Fortis invested aggressively over the past few years resulting in strong growth from its core business. You can expect revenues to keep growing as expansion continues. I like its goal of increasing its exposure to renewable energy from 2% of its assets in 2019 to 7% in 2035. In its five-year capital investment plan of ~$20B up to 2026, only 33% is financed through debt, while 61% comes from cash from their own operations.
Fortis’s capital-intensive operations make it sensitive to interest rates. Many income-seeking investors left equities to go to bonds and GICs. Also, with most of its assets regulated, it must get regulatory approval for each rate increase to its customers.
Fortis remains a utility; don’t expect astronomical growth. It’s definitely a defensive stock you can count on no matter what the economy’s like. It will keep paying a decent yield with a mid-single digit dividend growth rate.
ENBRIDGE (ENB.TO / ENB)
4th place (down from 2nd) – 1184 members
Income-seeking investors want to keep Enbridge and its 7%+ yield. I get that, but I got rid of my shares this year. ENB isn’t a bad company, but it lacks growth vectors, which doesn’t fit with my dividend growth strategy.
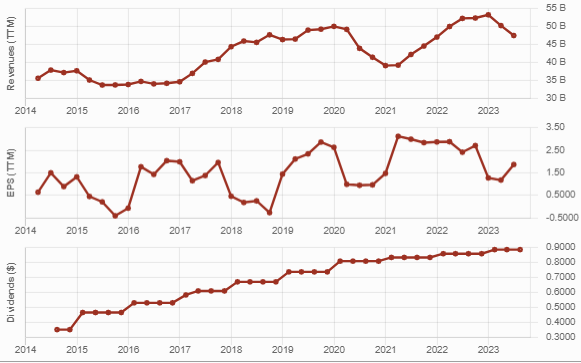
Like a toll road, Enbridge collects money day and night from oil & gas companies that use its “roads”, i.e., “pipelines”. We need oil & gas; Enbridge provides an impressive network of pipelines covering North America. Pipelines usually enjoy long-term contracts, sheltering them from short-term commodity price movements. ENB is diversifying through acquisitions in the natural gas business. It makes sense to lower exposure to crude oil. With 28 consecutive years with a dividend increase, you can rely on Enbridge to honor its shareholders’ investment.
![]() What’s not to like? Legal battles and debt! Building, maintaining, and replacing pipelines has become a toxic topic. Politicians and regulators are cautious about projects related to oil & gas transportation; they have environmental impacts and are increasingly unpopular with the public. So, more legal battles and fees, and increased likelihood that projects go sideways. This explains why Enbridge offers such a generous yield.
What’s not to like? Legal battles and debt! Building, maintaining, and replacing pipelines has become a toxic topic. Politicians and regulators are cautious about projects related to oil & gas transportation; they have environmental impacts and are increasingly unpopular with the public. So, more legal battles and fees, and increased likelihood that projects go sideways. This explains why Enbridge offers such a generous yield.
I like the move into the natural gas business, but not piling on more debt to do so. At one point, Enbridge has to pay down its debts. I’ll keep an eye on ENB’s dividend growth. It has slowed down to 3% per year after a generous run including double-digit increases. Does it make sense for management to increase it every year?
Truly the definition of a deluxe bond, Enbridge provides reliable income, but don’t expect much capital growth. Continue to monitor this one quarterly.
BCE (BCE.TO / BCE)
5th place (down from 4th) – 1175 member
Bell is a classic telecom company that combines wireline, wireless, and media. Most of its revenue comes from wireless and wireline business and 13-14% from Media. BCE’s yield is its most appealing feature. With interest rates on the rise, BCE still beats most GIC’s with a 7%+ yield. That generous payout comes with steady increases since 2009. Will it continue forever? That’s another story.
As BCE has limited competition and high barriers to entry. With its range of products, BCE can easily increase revenues generated from different customers. 5G should be a tailwind for years to come. BCE enjoys a relatively stable business generating predictable cash flows.
![]() However, it could become another AT&T (T). T pleased investors for years until things fell apart and ended up another high yielder nightmare for investors. With high interest rates, BCE’s debt burden could hinder its ability to increase dividends. Always monitor the dividend growth and start worrying if the trend slows down. Finally, if 5G doesn’t generate the expected cash flow, I wonder where BCE will find its growth.
However, it could become another AT&T (T). T pleased investors for years until things fell apart and ended up another high yielder nightmare for investors. With high interest rates, BCE’s debt burden could hinder its ability to increase dividends. Always monitor the dividend growth and start worrying if the trend slows down. Finally, if 5G doesn’t generate the expected cash flow, I wonder where BCE will find its growth.
This stock is a deluxe bond crafted for income-seeking investors. As long as the company shows increasing cash flow from operations and reduces its CAPEX to generate sufficient cash flow to cover the dividend, you’re in good hands.
 Over the years, TD has increased its retail focus, driven by lower-risk businesses with stable, consistent earnings. The bank enjoys the largest or second largest market share for most key products in the Canadian retail segment. TD keeps things clean and simple as the bulk of its income comes from personal and commercial banking. It has sizeable exposure in major cities like Toronto, Vancouver, Edmonton, and Calgary, combined with a strong presence in the US.
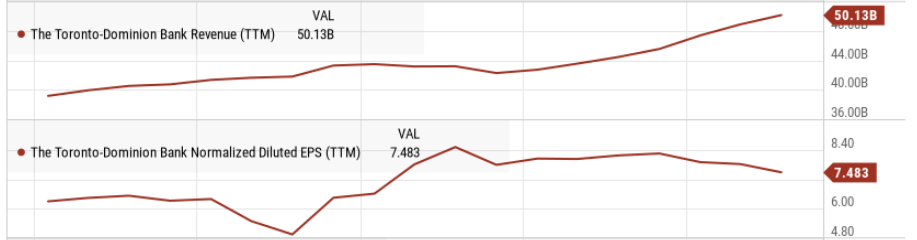
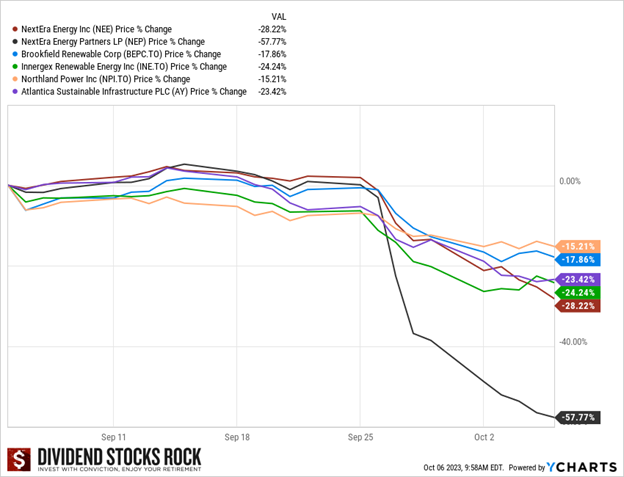
 Look for investors’ presentations and quarterly earnings reports on the company website. Doing that reveals that another renewable, Brookfield Renewable (BEPC/BEPC.TO), hosted its investors day in September. Contrary to NEP, BEPC reaffirmed its growth expectations and distribution growth targets…business as usual for BEPC.
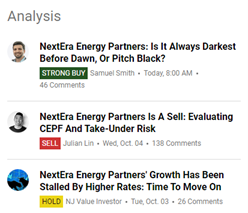 First, ignore the noise, or you’ll get lost in a myriad of conflicting information. Here are three articles on Seeking Alpha for October 6 (Strong Buy, Sell, and Hold ratings).
 I don’t use valuation to determine if the company is undervalued or not because, to be honest, your guess is as good as mine. If you put ten financial analysts in a room and ask them to determine the valuation of a company, you’ll likely end up with ten materially different answers.