• Skip to main content

MOOSE MARKETS

INVESTING THE CANADIAN WAY

  • Dividend Investing
    • Best Canadian Stocks to Buy in 2025
    • Dogs of the TSX – Beat The TSX! 2025
    • Canoe Income Fund
    • Canadian Banks Ranking 2025
    • Canadian Dividend Rock Stars List
    • Canadian Dividend Aristocrats 2025
    • Buy and Hold Forever Stocks
  • REITs
    • Canadian REITs Beginner’s Guide
    • Best Monthly REITs 2025
  • ETFs
    • Guide to ETF Investing
  • How To
    • Income Products at Retirement
    • 4 Budgets of Retirement
  • Portfolio Strategies
    • Canadian Depositary Receipts (CDRs)
    • Building an Income Portfolio – Made Easy
  • The Moose Newsletter
  • Podcast

How To

Retirement Tax Optimization Basics


Tax optimization is an important aspect of retirement planning. Beyond saving, investing, and accumulating wealth, examine how you can reduce the amount of tax you pay when retired.

Canadian currency, bills and coins, on white backgroundThis article doesn’t go deep into tax issues because each situation is different, with different applicable rules and tax rates. However, there are situations we all have in common upon retirement. After your retirement strategy is outlined, i.e., your global asset allocation, risk tolerance, types of investments, etc., you’re in a good position for some tax tweaking. Don’t do it the other way around.

Why do I believe one should perform tax optimization only after you have set your investing strategy? Because while it’s good to trim your tax burden, you should not do it at the expense of the bigger picture. In other words, I don’t think it’s all that bad to pay withholding taxes on dividends received if it enables you to have a more diversified and better performing portfolio.

See also Create your own Paycheck in Retirement

However, when it’s time to retire, the order and timing of withdrawals can greatly affect your budget. You can’t control your portfolio performance, but you can control a part of the taxes you’ll pay, or save, at retirement. Therefore, crunching numbers with a tax expert is likely to make a big difference in your lifestyle.

Canadians, learn about government retirement benefits.  Download our CPP and OAS guide.

My take on tax optimization

I’m not a tax expert, but after doing hundreds of financial plans for my clients as a financial planner back in my banking days, here are my conclusions.

First, know that there are no magic tricks for optimizing taxes. Any strategies viewed as “too aggressive” by regulators will be rejected and you’ll get a slap on the wrist

Two women talking while sitting at office table in front of brick wallThe best tax advice I can give you is quite simple: spend a few thousand dollars with a fee-based financial planner and an accountant. They’ll do the hard work and offer you a customized plan to optimize your taxes. Make your appointment, develop a plan, and avoid potentially costly mistakes.

To know more ahead of consulting an expert, or if you want to skip consulting and do it yourself, learn about the simple 3 Ds of tax optimization: Deduct – Defer – Divide.

Deduct: maximize deductions, reduce your taxable income

Anything you can use to reduce your taxable income automatically lowers your taxes, especially if you live in a country with increasing marginal tax rates like Canada. Examples of deductions you can use to reduce your income at any age include contributions to your retirement plans, interest paid on loans used to procure non-registered investments, and healthcare expenses.

Defer: postpone paying taxes as long as you can

Here’s a tip for my Canadian readers (I’m pretty sure it applies to Americans too, but you should verify this first). It sounds counter-intuitive, but in most cases, deferring the moment when you withdraw money from your tax-sheltered account (such as your RRSP account) is worth it. Here’s why.

The longer you wait to withdraw money from a tax-sheltered account or to trigger capital gains, the longer your money is growing tax-free. At retirement, it’s usually preferable to let your tax-sheltered account grow while withdrawing money from regular investment accounts, if possible. Remember that all investment income coming from a taxable account, whether it is withdrawn or reinvested, is income in your tax declaration.

Plant growing in clear glass pot filled with coinsSome retirees are tempted to withdraw money from tax-sheltered accounts earlier to pay less tax, as they assume their marginal tax rate to be lower at 60 years of age than at 85, when they anticipate they’ll have to withdraw more money. However, when you withdraw money, you pay the taxes immediately. The money paid to the government can’t compound going forward. Withdrawing at a younger age means you miss out on years of growth on tax paid.

For example, if you need $7,000, you could sell shares in a taxable account and pay a small amount in capital gains. Perhaps you’ll have to sell for $7,500 to receive $7,000 net of taxes. You could also sell for $10,000 in your RRSP to receive $7,000 after taxes. That extra $2,500 paid in taxes won’t compound tax free inside your RRSP for the next 20 years. At a 7% investment return, each $2,500 turns into $9,674 in 20 years from now. That’s almost 4 times the original amount!

Divide: divide your income with a spouse

Two cedar waxwing birds on a branch, with one giving a berry to the other

You can split assets or income sources with your spouse to keep each of your incomes in a lower marginal tax rate brackets. You’ll pay a lot less in tax if you split $100K of income 50-50 than keeping it solely under your name.


Tax optimization take away

Unfortunately, there are no secret ways to make taxes disappear, other than those usually referred to as fraud or evasion. If you’re Canadian and dislike the OAS claw back, look at it this way: being asked to payback some of the OAS benefits you received is a good problem to have; it means you likely have plenty of money to enjoy your retirement.

Canadians, learn about government retirement benefits.  Download our CPP and OAS guide.

An accountant can do a great job at drawing up a plan to optimize your taxes; the best way to approach tax optimization is to run multiple scenarios and see the impact of each choice. Don’t forget to always focus on your investment strategy first. Saving money in taxes is great, but making higher total returns is even better! Adding risk or reducing total return for the sake of taxes isn’t a good idea.

Retirement Cash Reserve: Surf the Market’s Waves

Having a cash reserve on-hand makes it easier to transition from your investment accumulation years to your retirement years and protects your portfolio during times of volatility.

Upright polar bear with one paw up, as if wavingThroughout your retirement, you’ll go through bull and bear markets. During a bear market, selling shares to generate your homemade dividend could hurt your retirement plan.

That’s when the cash reserve helps; it’s money that is not invested in the stock market anymore. It must be secure and easily accessible.

How to use the cash reserve

Your cash reserve bridges the gap between what your portfolio generates in dividends and your retirement budget; it prevents having to sell shares when it is not advantageous to do so.

If you need $50,000 per year and your portfolio generates $40,000, the gap is $10,000 per year.

The $10,000 gap could be filled by selling shares. Selling shares at a depreciated value could hurt your retirement, whereas dipping into a cash reserve keeps your portfolio intact. When the market recovers, you can sell additional shares to refill your cash reserve.

How much cash reserve is enough?

There’s no clear answer to this question. You want to mitigate the impact of market volatility on your withdrawal sequence, but you also want to maximize your portfolio returns.

A large cash reserve increases the short-term protection of your withdrawals but amputates your portfolio’s ability to generate higher returns on the market over the long haul.

Therefore, the amount of the cash reserve depends on the gap to fill and your tolerance to volatility. Some investors are comfortable without any cash reserve; they simply accept that they will sell shares yearly to complete their retirement budget, regardless of how the market is doing.

Others prefer a large cash reserve to cover all potential catastrophes. While most bear markets take around 24 months to recover, some have taken more than four years to fully recover.

Get some great stock ideas to build your portfolio and cash reserve with our Rock Stars List 

DOWNLOAD THE LIST HERE

Create a cash reserve

To create a cash reserve, you can stop reinvesting your dividends a few years before retiring and let the cash build up in your account. It’s on autopilot, simple, but it could take a few years to reach the required amount; during that time, the cash doesn’t generate any meaningful returns.

To let your portfolio work at full speed until the very last moment, you could sell one- or two-years’ worth of your financial needs in shares on day 1 of your retirement. However, if you retire at the bottom of the market, you’d be selling at a very bad time.

Cash reserve example

Imagine you have a $1M portfolio, an average dividend yield of 3.5%, and a retirement budget of $50,000/year. Since the portfolio generates $35,000 in dividends ($1M X 3.5%), the gap between what you generate and what you need is $15,000.

To ensure you don’t have to sell shares during a bad year, you decide to create a cash reserve of four years’ worth of the $15,000 gap, so $60,000.

Create and manage the cash reserve

In this example, a few years before start of your retirement, you stop reinvesting your dividends to let them accumulate. A year before your retirement date, you have your $60,000 cash reserve on hand.

You manage your cash reserve through a three-year ladder of Guaranteed Investment Certificates (GICs), Certificates of Deposit (CD), and/or bonds that would look something like this:

  • Three piles of golden coins, from small to large$20,000 for 1 year at 3%
  • $20,000 for 2 years at 3.25%
  • $20,000 for 3 years at 3.30%

You also keep accumulating your dividends in cash rather than reinvesting them.

At the end of the year, you retire

As you retire, your 1-year GIC/CD is worth $20,000 + $600 (one year of interest). Since you stopped reinvesting your dividends 12 months ago, you’ve also accumulated $35,000 in dividends ($1M X 3.5%).

Income on hand for year 1 of retirement

GIC/CD with interest $20,600
Dividends + $35,000
Total $55,600
Budget ($50,000)
Difference  + $5,600

You reinvest that extra $5,600 for another 3 years to feed the ladder and keep it going.

If it’s a good year and your portfolio is up, you sell shares to have just enough money to “refill” your bond ladder. Then you have another $20K to invest for 3 years. With the extra $5,600 on hand, you only have to sell $14,400 of shares to reach $20K and complete the ladder.

Notice that $14.4K on $1M equals a 1.44% capital gain. On most years, you’ll be able to do that easily without chipping away at your capital.

What if the market is bad?

If it’s not a good year and your portfolio is down, you can easily wait 6 months or a year and see where the market is at that time before selling shares. Really?  Yes, because you already have your income for the year and, at the end of year 1, you’ll have this on hand for year 2 of retirement:

2-year GIC/CD with 3.25% interest $21,321
One year of dividends* + $35,000
Total $56,321
Budget ($50,000)
Difference  + $6,321

* This is the same amount as the previous year; by investing in dividend growers, it is likely that some of your holdings increased their dividends, so this could be higher.

If at the end of year 2 of retirement the market is still bad, you still have your 3-year GIC/CD worth $22,046, and another 12 months of dividends from your portfolio.

Of course, waiting to sell shares during a bad spell in the market means that eventually you’ll have to sell more to refill your cash reserve ladder.

Retired couple walking toward the sea in Eastbourne on sunny day

Considering that most crashes happen over a few months or a year, after which the market starts recovering, and that the cash reserve ladder ensures you have over two years of buffer, you’ll be in a good position to refill the ladder using only or mostly your capital gains and dividend increases, thus securing your retirement for year to come!

DDM Stock Valuation to Compare Stocks

One of the most debated topics among investors is how to assess the value of a stock. I like to use stock valuation models like the Dividend Discount Model (DDM) to compare similar stocks I have already thoroughly analyzed and find interesting, to see which one might be the best deal.

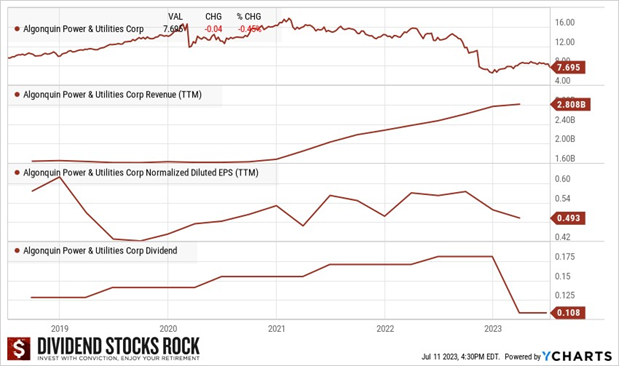
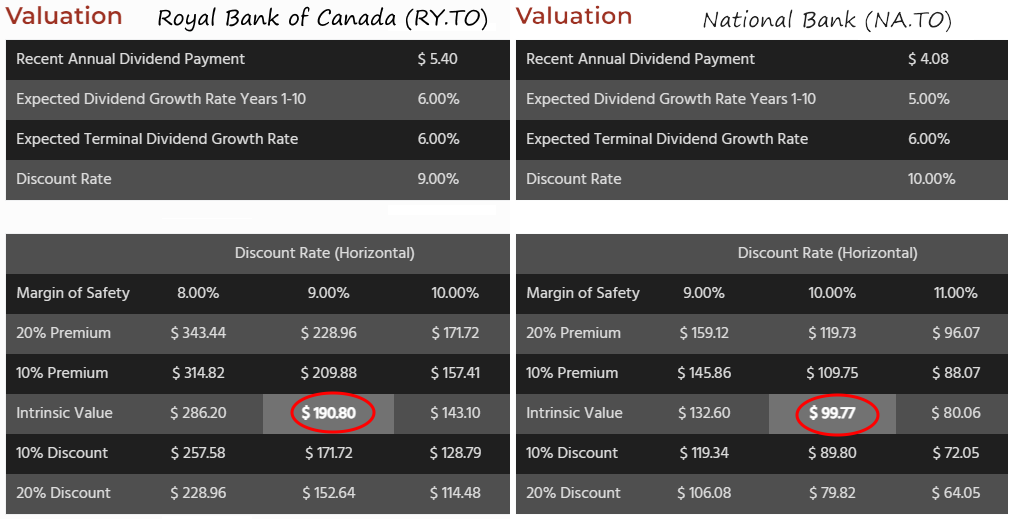
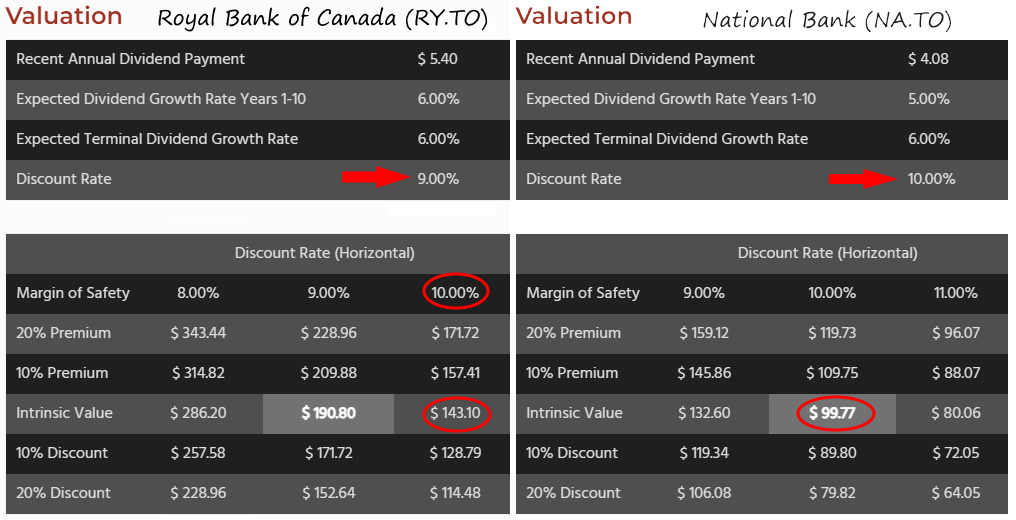
I don’t use valuation to determine if the company is undervalued or not because, to be honest, your guess is as good as mine. If you put ten financial analysts in a room and ask them to determine the valuation of a company, you’ll likely end up with ten materially different answers.

They’re all smart folks, but each of them has a different perspective. However, using a valuation tool with the same perspective and applying it to two or more companies in the same sector makes it easier to identify which one is the best deal and the best fit with my investment thesis.

To clarify this process, let’s compare two Canadian banks: Royal Bank (RY.TO) and National Bank (NA.TO).

Analyzing RY.TO and NA.TO

Before looking at the fair value of Royal Bank and National Bank as per the DDM, any investor interested in them should analyze both; study their business model, look at their dividend triangle, evaluate the safety and growth potential of their dividend, identify their growth vectors and their risks. For details about what I do to analyze stocks, read this article.

Our diligent investor might summarize the analysis like this:

Business model:

  • Both RY and NA are regulated and diversified Canadian banks
  • RY is much larger than NA ($181B market cap vs. $35B)
  • RY is more distributed geographically than NA, which is heavily concentrated in Quebec

Dividend triangle, dividend safety and growth:

  • Both banks have a strong dividend triangle showing growth in revenue, EPS, and dividend
  • NA shows slightly faster dividend growth since early 2022 and higher growth numbers over 5 years for all three metrics
  • Dividend payout ratios are under control for both, with RY near 45% and NA near 37%

Growth vectors:

  • RY has diversified revenue streams and is increasing its activities outside Canada
  • RY targets growth in wealth management, capital markets, and insurance, with this trio already representing over 50% of its revenue
  • NA follows a growth by acquisition strategy, targets wealth management and capital markets
  • NA is more flexible and quicker to move due to its smaller size

Risks:

  • RY capital markets and insurance growth vectors are inclined to variable returns
  • RY has high exposure to Canadian housing market and the effects of rising mortgage rates
  • NA is dependent on the Quebec economy, although it has been expanding with private banking in western Canada and investments in emerging markets, such as the ABA bank in Cambodia
  • NA takes more risks to find growth vectors

DOWNLOAD THE LIST HERE

With all this analysis information on hand, our investor still hesitates between Royal Bank and National Bank and now turns to the DDM valuation to compare them.

Comparing NA.TO and RY.TO Valuation

Here is the DDM valuation data for both Royal Bank and National Bank taken from their respective stock cards on the DSR website.

DSR DDM values for RY.TO and NA.TO with intrinsic values circled in red

At the time of writing, National Bank was trading at about $103 per share and Royal Bank at around $131.00 per share.

Looking at this data to compare both banks, including the value circled in red for each bank, observe the following:

RY NA
DDM Intrinsic value $190.80 $99.77
Current stock price $131 $103
Stock currently trading at 45% discount 3% over its value

At 45% discount, RY looks like an amazing deal, a slam dunk, right? It certainly does, but…there is a crucial difference to understand here, which is the discount rate. The discount rate, also known as the “expected return”, represents the minimum acceptable rate of return that an investor expects to earn on their investment to compensate for the risk and opportunity cost of investing in that particular stock.

Compare Apples to Apples

Notice below that the discount rates used for the intrinsic value of RY and NA are not the same. Due to RY’s geographic distribution and revenue stream diversification mentioned earlier, we used a discount rate of 9%, whereas NA’s more audacious approach made us use a 10% rate.

DDM values for RY.TO and NA.TO with values for the same discount rate circled in red

If we compare both banks with the same discount rate of 10%, we see that the difference between the two is significantly reduced.

  RY NA
DDM Intrinsic value $143.10 $99.77
Current stock price $131 $103
Stock currently trading at 9% discount 3% over its value

If you hesitate between RY and NA, a look at the DDM value confirms that your dilemma is between two really good stocks. RY might seem a better deal at current prices, but NA could be a better pick if you want more growth potential and are prepared to live with more volatility in the stock price.

I have both Royal Bank and National Bank in my portfolio because both fit my investment thesis. I appreciate National Bank’s significant growth potential and Royal Bank’s more stable and steady approach. As a reliable source of income that also shows growth vectors, RY.TO is also included in the DSR Canadian retirement portfolio model.


Stock Buying Process – Here’s What I Do

Hey there! Not sure which stocks to buy and feeling overwhelmed? Well, let me share my stock buying process with you. It might just help you out. Here’s how I do it, in a nutshell.

1 – Find stocks with strong dividend triangle 

Stock Buying Process: find promising companies - Magnifying glass

Using a stock screener, like the DSR stock screener, I find stocks with a strong dividend triangle. That means I look for companies that show trends of increasing revenue, earnings per share, and dividends. Ideally, I want to see continuous growth in all three areas. This is my initial buy list.

2 – Focus on stocks with strong 5-year dividend growth

I focus on stocks with solid dividend growth over the past 5 years. I’m a fan of dividend growers rather than high yielding companies with stagnant growth. So, I narrow down my list to those companies that have shown the strongest dividend growth over the past half-decade.

3 – Select only sectors I like and understand

I trim down my buy list further so that it only includes stocks in sectors I’m interested in and actually understand. It’s crucial to grasp the economic sector or industry in which you invest. This helps you feel confident out about your investments and lowers stress.

Each sector has its own ups and downs, although not at the same time during an economic cycle. Some are more resilient during a recession; others outperform the lot in bull markets. A market crisis hurts all sectors, but some more than others. We never know which industries will suffer the most though; banks in the 2008 financial crisis, oil & gas businesses in 2015, entertainment, travel, leisure, and retailers in the 2020 pandemic.

That is why I don’t put all my eggs in one basket. So, while I focus on industries I understand, I choose them in several sectors. I never invest more than 20% of my money in one sector; in doing so, I diversify my portfolio and minimize the impact of market drops on specific industries.

4 – Select stocks with strong dividend safety

Next in my buying process, I dig deeper into each company’s financials to make sure they have strong dividend safety. How specifically? I look for companies with not only healthy revenues and earnings, but also strong cash flow generation. Company financial reports and the DSR stock cards give me a good insight into a company’s cash flow from operations and free cash flow metrics.

Only then do I check out the infamous payout and cash payout ratios. But here’s the thing: I don’t rely solely on payout ratios right away. They can be misleading. Sometimes, high payout ratios are justified, for example when they are due to investments for future growth, and the company is still a solid dividend grower.


5 – Study the business model

Now that I’ve done my homework on the financial side, I dive into understanding each company’s business model to know how they make money and how they plan to grow in the future. For example, what do they sell, who do they sell to; is demand for their products cyclical, growing, stagnating; are the products and markets diversified; is the growth through acquisitions, innovation; is it a very competitive industry; and more.

If I can’t explain the business model in simple words a 12-year-old would understand, I don’t fully grasp it. I remove the company from my list and move on to the next one.

6 – Identify potential risks and growth

Stock buying process: know the risks! Cautio wet floor sign in ocean surfNow comes the fun part. I identify potential risks and growth prospects for each company. It’s important to be realistic and not get carried away by the positive aspects. I look at growth trends to see if they’re slowing down, review the evolution of company debt over the years, and consider potential downsides like vulnerability to inflation, interest, regulation, patent expiry, and competition. I read up on bear theses to understand why some investors might dislike a company. It’s important to know what I’m getting into and to be prepared for any challenge that may arise.

7 – Look at valuations: immediate buy or add to watchlist

Valuation is another factor I consider, but it’s not the be-all and end-all. I’d rather buy a stock with a strong dividend triangle, great growth prospects, and lots of potential for the next decade, even if it seems overvalued; I’d take Microsoft over AT&T any day. I might keep “overvalued” stocks on my watchlist and wait for the right opportunity. Quality takes priority over short-term undervaluation in my stock buying process.

I use two valuation methods. First, I review the PE ratio and the dividend yield over the last 5 years. This shows how the market values the stock over a sizeable part of an economic cycle; did the PE grow, i.e., the price grows faster than earnings, or was it stable year after year. Reviewing yield pinpoints opportunities when the yield is better than its 5-year average. For stocks yielding 3% or more, I look at the valuation from the dividend discount model (DDM).

8 – Write my investment thesis and click BUY

Finally, I write down my investment thesis for each company, laying out the reasons why I think it’s a great investment along with the potential downsides.

This helps me to stay focused on why I buy a stock and, later on, evaluate if my original reasons for investing still hold true. The market and companies change all the time—remember what Apple’s iPhone did to Blackberry, or how the pandemic-induced shift to remote working affected office space REITs—so it’s crucial to keep an eye on things and reassess regularly.

So, there you have it! That’s my stock buying process in a nutshell. By following these steps, you can make more informed decisions, focus on dividend growth, and build a well-diversified portfolio based on your understanding of different sectors and individual companies. Happy investing!

Never Again! How to Avoid Loser Stocks in your Portfolio

I’m sorry to say there is no foolproof method to avoid loser stocks in your portfolio. It’s impossible to not make occasional mistakes as investors. If you can’t bear the thought of losing 30%, 40%, 50% of your investment in a stock, you should probably not invest in equities.

However, you can minimize the risks. In fact, you can reduce the number of times it happens, and you can also reduce the impact of those rotten apples in your portfolio. This starts by acknowledging our mistakes.

Recognizing our mistakes

I’ve made mistakes in my investment journey. For example, with Algonquin (AQN):

  • I let the company narrative take too much importance in my analysis and ignored the financial numbers. Who doesn’t like a good story, right? Always rely on company fundamentals and metrics; they either back the narrative or reveal it as fiction.
  • Wearing pinked-colored glasses, I hoped for the best outcome and minimized the impact of the worst-case scenario.
  • I put too much faith in company management, thinking it would keep paying the dividend. Obviously, the dividend wasn’t a priority for AQN’s management team.

Algonquin's decline depicted with graphs of its share price, revenue, EPS and dividend from 2018 to 2023.

Other common investing mistakes are:

  • Being seduced by a high yield: investors often concentrate too much on the generous dividend yield in their decision to buy or keep a stock. Appealing as a high yield might be, it is often a warning sign.
  • Underestimating the potential downside of a company. No company is invincible. Being aware of the risks is a good defense; knowing about a company’s dependency on the housing market will alert you to watch its results when interest rates rise. Just as risk awareness helps to spot a problem stock, it can also prevent bad buying decisions.

Another mistake that adds to the pain of having a loser stock is investing heavily in a single stock, thus granting it too much weight in your portfolio, without considering the effect a dropping stock price will have on your portfolio.

An ounce of prevention: portfolio review to detect loser stocks

Always review of all your holdings quarterly so that you can detect when you have overweight sectors or stocks, verify that growth is still in the cards by consulting the dividend triangle, identify red flags, and investigate them properly.

During your quarterly review:

  1. Identify your core holdings, educated guesses, and falling knives
  2. Make sure your core holdings represent most of your portfolio; rebalance if needed.
  3. If you see a dividend yield above 5%, consider it a red flag and investigate that stock further; does it still fit your investment thesis? Does the company have growth vectors? Are the revenue and EPS growing consistently? Is the dividend growing, has its growth slowed down?
  4. Be more demanding about the stocks you keep, for example, look for stronger dividend triangle, a low payout ratio, companies meeting expectations and not lowering their outlook.
  5. Do not hesitate to sell a loser stock, even if it hurts.
  6. Resist the appeal of exciting, sexy, growth stories. Go for boring, yet consistent and recession-resilient investment narratives.

Have a replacement list ready

When a $10,000 investment is now worth $6,500, I try to get the $10K figure out of my head and focus on how I can most efficiently invest what is left.

Make a list of stocks you’d like to have but don’t have money to invest in yet. Choose companies that have good growth potential and a strong dividend triangle in different sectors. Not sure where to start? Download our Dividend Rock Stars list!

DOWNLOAD THE LIST HERE

Comparing two stocks

Equipped with my replacement list, I look for a decent replacement in the same industry as the loser stock I’m considering selling. Then, I compare both stocks, analyzing six factors:

  1. The business models

Review the business models to understand how each company can make money and to find similarities and differences between them.

  1. The dividend triangle

The dividend triangle is an overview of a company’s metrics and the trend of its revenue, EPS, and dividends. Two companies in similar environments would have similar growth metrics.

  1. Dividend safety & growth potential

How of the dividend going to evolve? Double-digit or mid-single digit growth? Low growth, no growth, or cut? Dividend safety and growth potential is assessed by analysing the dividend triangle, the company’s payout ratios, and potential risks.

  1. Growth vectors

Growth vectors point to how a company should grow in the coming years. Reviewing a company’s business model and studying revenue and earnings trends can give you a good idea. Two companies in the same industry can show similar growth vectors.

  1. Potential risks

Review the risks the companies face; are they particularly vulnerable to interest rates, commodity prices, increased regulation? Do they carry a high debt load? Are they in an expanding market? Companies in the same industries might face similar risks.

  1. Valuation

To compare two companies, assess the value of each one’s stock value. Valuation methods include the P/E ratio trend over several years and the Dividend Discount Model (DDM).

Dividend Stocks Rock (DSR) members can find all of the information needed on the stock cards and compare two of them side-by-side. Other sources of information are the investor relations section of each company’s website, and stock reports by third-party financial analysts.

Smith Manoeuvre – A Tax Deductible Mortgage Strategy

The Smith Manoeuvre is a Canadian strategy that is designed to structure your mortgage so that it is tax deductible.

Since the Real Estate market has gone up in value significantly over the past few years, I’ve decided to use some of that equity sleeping in my house to invest in the stock market.

For Canadians, this means I’m doing the Smith Maneuver (transforming the interest paid on my mortgage into a tax-deductible expense). For all other investors, this article will talk about leverage in general. Should you borrow to invest? What’s the possible outcome? What are the risks? How to start investing with borrowed money? These are the subjects we will discuss today!

Why do a Smith Manoeuvre?

First things first, the Smith Manoeuvre includes leverage. This means borrowing money to invest. This is not for everyone (more on that later), please do your due diligence and make sure you have the right risk profile before using leverage.

All right, now that we have the disclaimer out of the way, here’s some background information from yours truly. In 2003, I completed my bachelor’s degree with a double major (finance & marketing). I started a job at National bank in the credit department for partnerships with Power Corporation. My goal was to help financial advisors build credit applications for their clients who wished to use leverage to provide capital for investments. In other words, I was the architect behind millions of dollars of investment loans.

I also used the Smith Manoeuvre for several years back then with great success. I saw the best and the worst of this strategy throughout those five years. I’ve seen investors build enormous wealth and others have burned down tens of thousands of dollars on a margin call. I can’t stress this enough; leverage can bring the best out of the stock market and can also destroy your wealth. Please use this strategy with caution.

Wealth generation

Why did I decide to use such a “dangerous” strategy? Because I have time, knowledge and an incredibly high-risk tolerance on my side. The math behind leverage is quite simple. If you can borrow money at a 3-4% interest rate and then invest it at a 6-7% return, you can create wealth out of thin air.

With conservative numbers and $333.33 per month ($4,000 / 12), you can create more than half a million dollars in 30 years.

Imagine borrowing $100K at 4% for the next 30 years. The cost out of pocket would be $4,000 per year, or $120,000 for the entire duration of this loan. Keep in mind that the $4,000 doesn’t move (unless your interest rate changes). This means that $4,000 in 20-30 years from now isn’t that much if you factor inflation.

Now if you take that $100K loan and you invest it at a 6.5% average annual return, 30 years later your investment would have grown to $661K. You could then pay off your loan and end-up with more than half a million dollars. Over 30 years, you turned $120K into $561K (more than 4.5 times your investment). With leverage, the advantage is that you turned a 6.5% return into 9.1% (you must achieve a 9.1% investment return on a yearly investment of $4,000 to reach $566K in 30 years.

Using a 6.5% expected return is quite conservative (see the chart of the S&P 500 and the TSX on the following page). I could potentially talk about 8.5% return and how you could transform the same $120K in interest payment into more than $1M net of debt.

But that’s daydreaming and you must also consider taxes applicable to this strategy. Now that you understand the wealth generation ability, let’s talk a little bit more about the dangers inherent in this strategy.

S&P 500 and TSX total return

The danger of leverage – This is not for everyone

While I used conservative numbers (a 100% equity position should generate an annualized return of 6.5% over a 30-year period), this is still a positive scenario. If you borrow $100K today and your investment goes down by 30%, you then have $70K invested and you are still paying interest on a debt of $100K. You could also get sick or need additional money for many reasons. These perspectives are enough to make a lot of investors sick. At best, leverage should be a complement, not a “all-in” strategy. It could turn even worse if you have a margin call.

If you use your investment as collateral, there is a good chance that the bank will set a minimum value for your portfolio to maintain the loan. When your portfolio goes down too low too fast, the bank will “call you” and ask you to put more money in the portfolio. If you don’t have liquid assets, the bank would simply sell your investments and use the proceeds to cover the loan (or a part of it).

Because I want to slowly build my leveraged portfolio and I don’t want to get squeezed by a margin call, I’ve decided to use my house as collateral for my leverage strategy. Here comes the Smith Manoeuvre!

What’s the Smith Manoeuvre?

The Smith Manoeuvre is a Canadian strategy that is designed to structure your mortgage so that it is tax deductible. A financial planner named Fraser Smith introduced this concept where you borrow money against the equity in your home, invest it in income-producing entities (dividend paying stocks), and use the tax return to further pay down the mortgage. It’s not that impressive for our fellow Americans since their mortgage interest is already tax deductible. But it’s a big thing for Canadians since we don’t have this advantage!

To set this strategy up, you need a home equity line of credit (a source of revolving credit). Then, each month, you pay off a part of your mortgage (imagine $500 in capital). Right after you pay off that capital on your debt, you use the home equity line of credit (HELOC) and borrow that same $500 and invest it.

Month Mortgage HELOC Interest paid Investment Account Net Wealth Creation
0 (start) -$200,000 $0 $0 $0 0
1 -$199,500 -$500 $1.66 $502.70 $1.04
12 -$194,000 -$6,000 $130.04 $6,215.50 $85.46
360 -$20,000 $180,000 $108,300 $556,084 $267,784


Following this chart, I could transform $180K of debt into a tax-deductible mortgage by simply using $500 a month for my leverage strategy. You could go a lot faster by increasing the amounts. Obviously, if you boost the amount invested or increase the percentage of expected return, the strategy looks even more attractive.

The largest advantage of leverage (on top of the tax deductibility) is the power of compounding interest. While the interest you pay monthly doesn’t compound, the amount invested is compounding. Throughout time, a small difference of 2.5% (4% interest vs 6.5% investment return) creates thousands of dollars even if you start small.

All about long-term

The point here isn’t to make you dream about riches, but rather to show you how even a conservative leverage strategy could create incremental wealth. The plan I’m about to discuss applies to the start of my Smith Manoeuvre (with $500 a month) but could be applied to a larger leverage amount either using a monthly investment or a lump sum payment.

Keep in mind that the basic rules of leverage will apply on a $500 or a $500,000 loan. The way you build your portfolio and how you should approach this strategy remains the same. Numbers are just growing with zeroes, but they react the same to the power of compounding interest.

In the next two parts of this article, I’ll share with you my plan and the portfolio model I wish to build in the coming years. I will show you how to use DSR tools to build your own leverage strategy.

The Smith Manoeuvre Plan

The purpose of this exercise isn’t to make you follow my plan and invest the same way. I want to provide you with a guideline as I am building this wealth creation strategy. As I successfully built my pension portfolio using exclusively Dividend Stocks Rock tools, I’m doing the same thing for the Smith Manoeuvre portfolio. Numbers and details could change depending on your financial situation, your age, and your risk tolerance. Again, do your own due diligence.

Opening a margin account allows options

First things first, which type of account should you use to invest using leverage? Since I’m a bit crazy, I’ll be opening a non-registered margin account. To make your leverage strategy successful, having a non-registered (meaning a taxable account) is mandatory. One of the perks of leveraging is to be able to use the interest you paid on your loan against the investment income you generated. Therefore, using the 4% interest rate and the 6.5% expected returns numbers, the first 4% return of the portfolio is “tax free”.

Margin account

Opening a margin account instead of a regular non-registered account is to give me additional flexibility. My goal isn’t to use margin on top of borrowing money. That’s what we could call a “double-dip”. However, if the market drops drastically, I’d like to have additional liquidity ready to be deployed. Imagine if my pension plan was in a margin account during March of 2020. I could have easily borrowed $50K and boosted my positions into amazing companies like Canadian Banks, Telcos, Utilities and Tech stocks.

My margin account also allows me to trade options. Since the goal of this portfolio is to generate investment income, I would also leave the door open to writing covered calls in the future. This would obviously not happen right away, but I would rather be set with the most flexible investment account upfront. Then, I don’t have to worry about any other paperwork.

Setting a budget

Once I decided to open a margin account allowing option trading, it was time to determine how much money I wanted to borrow each month (or a lumpsum amount if you have lots of equity sleeping in your house). Keep in mind that leveraging should be a complement to your wealth generation plan. Your financial plan should not rely solely on leverage.

The reality of a business owner is that there are always a thousand things going on in my financial life. Therefore, I don’t want to go “all-in” with my Smith Manoeuvre for now. For this reason, I thought of starting with $500 per month. This enables me to keep my financial flexibility (and continue to support my children as they go to college!). I will revisit this amount separately each year.

If you intend to use a larger amount for your leverage strategy, I’d suggest you consider two things. First, the amount of interest that must be paid monthly on that loan. It’s fun to imagine the compounding interest on a $250,000 investment over the next 20 years, but this requires cash flow in the meantime. At $250K, we are talking about a very nice car payment $833.33/month at 4%. To make sure the leverage strategy works, the most important thing is to have time. Therefore, you must ask yourself if you can afford a “BMW payment” for the next 20 years or so.

Investment rules

As you know already, I like to keep things simple. There is no need to have a complex investing strategy because you have borrowed money to invest. However, there are a few more rules to observe for this specific approach.

#1 Follow the DividendStocksRock methodology

When you borrow to invest, you want to reach a balance between generating an interesting total return and making sure you don’t put your portfolio at risk. Taking “bets” would end-up badly in a leveraged portfolio while focusing on dividend growers will achieve this balance. The DSR methodology to pick stocks will apply perfectly to this strategy (but I’ll add rule #4 in my stock selection process).

#2 Invest for the long term (minimum 20 years)

I’m currently 40 and I plan to use this strategy for the next 30-40 years. Since it’s a compliment to my wealth generation plan, I will be able to keep my leverage strategy above 70. The idea with leverage is to use compounding interest to your advantage. You can only do that over a long period of time.

#3 Invest 100% in Canadian stocks

I’m not your tax guy, but if you are Canadian and you want to play around taxes, it would be a good thing to invest in Canadian stocks to benefit from the preferential Canadian dividend tax treatment. Only Canadian corporations will pay eligible dividends. Therefore, I’ll keep my love for U.S. dividend growers in my tax-sheltered pension (LIRA) and retirement (RRSP) accounts exclusively.

#4 Generate a minimum yield of 5.5%

Right now, my HELOC interest rate is set at 5.4%. Therefore, my portfolio must generate at least 5.5% in dividend income. Again, I’m not your tax guy, but if you are Canadian and you wish to deduct the interest you pay against your investment income, it can’t be used against capital gains (e.g., it must be interest or dividend income). Then again, it doesn’t mean that all stocks in your portfolio will offer a 5% yield and above, but the total generated by the portfolio must be in that range.


Smith Manoeuvre Execution – Portfolio Model

To select the companies “worthy” of my leveraged portfolio, I will get inspiration from the Canadian Retirement portfolio and the 100% Canadian portfolio models. I’m looking at stocks offering a decent yield (minimum of 3%) but with some growth opportunities as well. I used the DSR stock screener, the watch list (PRO feature) and the portfolio builder (PRO feature) to build my portfolio model. If you can’t use the DSR stock screener, you can look at the Dividend Rock Stars List here.

Stock selection using DSR stock screener

stock screener smith manoeuvreThe first step in finding interesting stocks is to go to the Canadian Retirement portfolio and the 100% Canadian portfolio models’ pages and select companies with a minimum rating of 3 for both the DSR PRO rating and the Dividend Safety Score. I also added a minimum dividend yield of 4% as I want to make sure I can use the full 5%+ interest rate that will be charged on my loan by the end of the year. Right now, I’m at 5.4% on a variable rate. That helped me to select a few stocks, but it wasn’t enough to build a complete portfolio. I wanted to double-check across our entire stock library.

Then I used the same filter with the stock screener. I don’t want to start too narrow. This simple set of filters gave me a list of 75 companies. To build a diversified portfolio, I’d like to have about 20 stocks. The plan is to buy one position each month over the course of almost two years. Having to investigate 75 stocks upfront seems a bit overwhelming.

So, here’s my trick: I kept the filters in place and looked at each sector one by one. After all, there is no point in looking into 10 stocks in the same sector. If this happens, I can always add more minimum metrics or select stocks with a rating of 4 for the PRO rating or the Dividend Safety Score.

I then selected my favorite 3-4 companies per sector to see how many companies I could rack up. Between both techniques, I got to a short list of 22 stocks that might make a good fit for my portfolio.

Deep dive with the watch list

Before I started my research with the stock screener, I emptied my watch list. The watch list enables you to see only the stocks you have selected in the screener. This is great to create a group of companies you like and want to follow going forward.

I selected each stock that looks interesting by clicking on the star button on the left side of the stock screener. Those selections are then automatically reported to the watch list.

Why would I bother to add all those stocks to a watch list? For two reasons:

#1 I will invest in new companies each month for a long time. I want to keep a close eye on my prospects.

#2 I can then look at my favorite stocks and download the excel spreadsheet with all data

While I love our stock screener, when you look at 30 financial metrics, it’s not that easy to see them and sort them as you want. Excel is a better software to use to make an additional triage among the list of your potential stocks. Then, I can read each stock card and start building my portfolio! Will I go ahead and buy the 22 stocks? Let’s build a fake portfolio to see what it looks like, shall we?

Sector allocation verification with the portfolio builder

The last thing to do before pressing the buy button is to check to see if the portfolio makes sense. I won’t have to make ~20 buy decisions today, but it helps to have an idea of where I’m going with my purchases. Therefore, I’ve built a fake portfolio using the portfolio builder. Good news: in a few months, you’ll be able to select which portfolio you want in your consolidated reports. You will select which portfolio(s) you want and generate as many reports as you wish!

Here’s the list of all the potential stocks after the review:

Symbol Name Sector Pro Rating Dvd Safety Dvd Yield Fwd
AP.UN.TO Allied Properties REIT Real Estate 4 3 6.74%
AQN.TO Algonquin Power & Utilities Utilities 4 4 6.81%
ARE.TO Aecon Group Industrials 4 3 7.72%
AW.UN.TO A and W Revenue Royalties Income Fund Consumer Discretionary 4 3 5.63%
BEP.UN.TO Brookfield Renewable Utilities 4 4 4.34%
BEPC.TO Brookfield Renewable Utilities 4 4 4.14%
BIP.UN.TO Brookfield Infrastructure Utilities 4 4 4.04%
BMO.TO bmo Financials 4 4 4.35%
BNS.TO ScotiaBank Financials 4 4 6.22%
CM.TO CIBC Financials 4 4 5.31%
CNQ.TO Canadian Natural Resources Energy 4 4 4.12%
CRT.UN.TO CT REIT Real Estate 4 3 5.44%
EIF.TO Exchange Income Industrials 4 3 5.47%
EMA.TO Emera Inc Utilities 4 3 5.63%
ENB.TO Enbridge Inc Energy 4 3 6.39%
FTS.TO Fortis Inc Utilities 4 4 4.30%
GRT.UN.TO Granite REIT Real Estate 4 4 4.13%
GWO.TO Great-West Lifeco Financials 4 4 6.48%
KMP.UN.TO Killam Apartment REIT Real Estate 4 3 4.28%
NET.UN.V Canadian Net REIT Real Estate 4 4 5.50%
PKI.TO Parkland Corp Energy 4 3 5.12%
POW.TO Power Corp. Financials 4 4 5.98%
SYZ.TO Sylogist Information Technology 4 3 8.74%
T.TO Telus Communication Services 4 4 4.92%
TD.TO TD Bank Financials 5 4 4.03%
TPZ.TO Topaz Energy Energy 4 4 5.13%
TRP.TO TC Energy Energy 4 3 5.99%

I’m not saying this will be my final portfolio. However, it’s a great start and it gives me a very strong buying list to look at. Each month, I’ll go deeper in a specific stock and adjust along the way. Remember, investing is like hiking, you don’t get to the summit or get a great view during the first 100 meters.

Why Using Leverage? Should You Do It At Any Age?

I’d like to end this article on a very important topic; at what age leverage becomes irrelevant? I’ve highlighted the point of risk tolerance several times. If you can’t sleep when your portfolio is down 10%+ or because interest rates are rising, leverage isn’t for you. Not now, not at any age. Period.

As a banker, we used a few rules to qualify investors for an investment loan (on top of having a very high-risk tolerance). I’ve modified them a little:

Smith Manoeuvre Rules

#1 Don’t borrow too much. I believe the rule back then was to not borrow more than 50% of your liquid net worth (liquid = investments, no houses or rental property)

#2 Make sure you can afford to make the loan payment. The investment and growth parts are fun, but if you can’t pay the loan from your regular income, don’t go there. You don’t want to squeeze your budget with another loan.

#3 Invest for 20 years or go home. The rule was more to do it at least for 10 years, but it seems a bit short to my taste. The idea is to go through a full economic cycle (recession + expansion). If you can let your investments ride through several economic cycles, you will realize the full power of compounding interest. In other words, it comes down to: Don’t borrow what you cannot afford and let your investment run for a long time.

If you can withstand fluctuations (and you keep your eyes on the long-term horizon), using leverage before 50 is a very smart move. I’ve used leverage several times in the past and it paid off nicely. Using leverage for 20-40 years seems like a no brainer. But is it the case when you are 50 or even 65?

Should you use leverage at 50? Over 65?

Assuming your life expectancy is somewhere between 85 and 95, if you start a leverage operation at 50, this means you have a good 35 to 45 years to make it bloom. This should be enough to generate wealth for the next generation (and hopefully for your grandchildren too!). Therefore, it would make sense (assuming, again, that you have a high-risk tolerance).

Finally, The “last chance” to do a leverage operation is probably when you get close to 65-70. I really focus on that 20-year period to make sure the investment grows and blooms. I don’t think it would be useful to start leverage in your 70’s as it would likely bring on more stress than anything else. Again, some people want to generate additional wealth for generations to come and this strategy provides a vehicle for that incremental growth.

I hope this article has given you some food for thought. I’ll be covering my Smith Manoeuvre in my portfolio newsletter update going forward. You’ll be able to follow my progress.

  • « Go to Previous Page
  • Page 1
  • Page 2
  • Page 3
  • Page 4
  • Go to Next Page »

Copyright © 2025 · Moose Markets