Retirement used to be seen as a finish line. Today, it’s more of a turning point—a new phase of life filled with possibility. But behind the dream of travel, time freedom, and meaningful pursuits is a single, recurring concern: Do I have enough to enjoy the life I want?
That question isn’t just about the size of your savings. It’s about making smart, confident decisions in a world of ever-changing markets, tax rules, and personal goals.
The good news? You can simplify the complexity by focusing on five essential questions. These aren’t financial formulas—they’re strategic filters to guide your thinking, reduce overwhelm, and help you take action.
1. Do You Have Enough?
Let’s start with the big one: do you have enough to retire comfortably and stay retired?
This isn’t just about hitting a magic number. It’s about aligning your income sources (pensions, savings, investments) with your expected lifestyle over the next 25–30 years. That means accounting for inflation, healthcare, market variability, and life’s unpredictable moments.
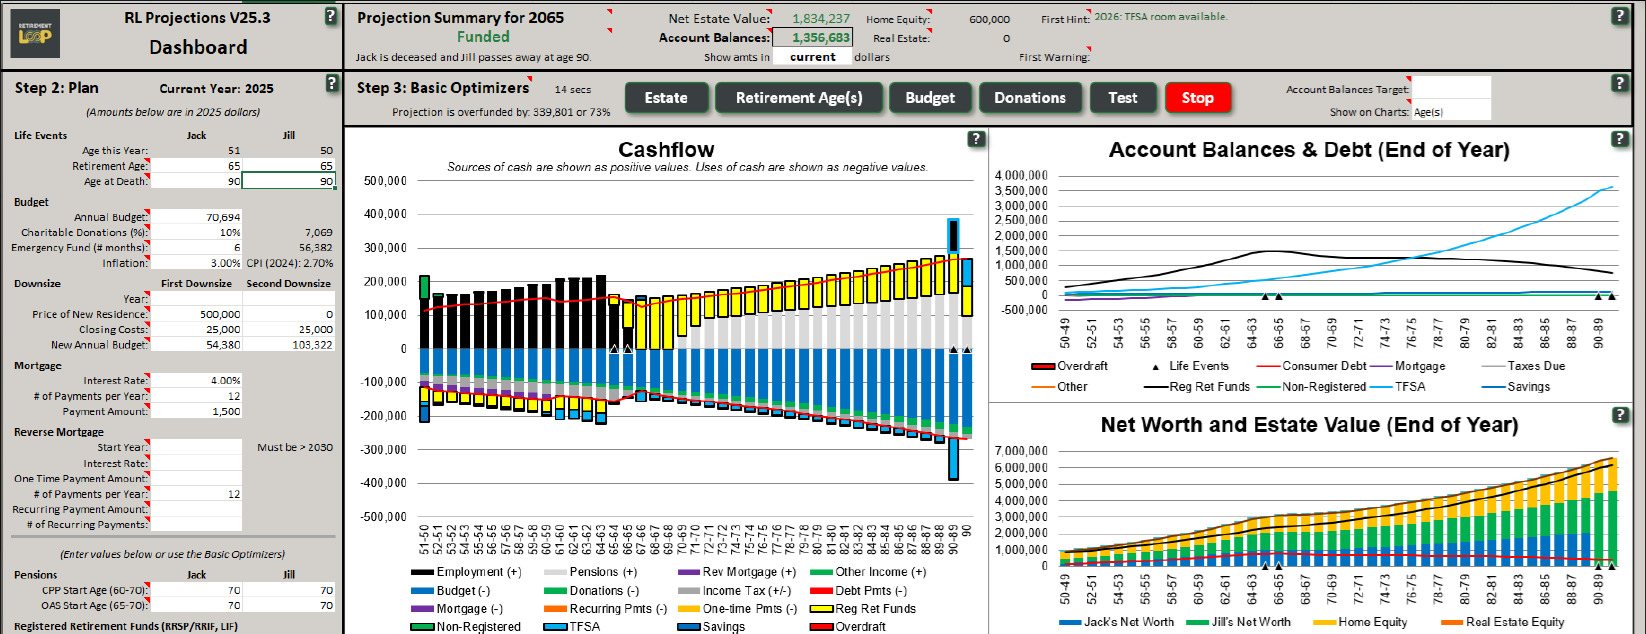
Rather than relying on outdated rules of thumb or flat withdrawal rates, modern retirement planning uses dynamic projections that adapt to your spending, not the other way around. These models show whether your plan holds up—and help you course-correct early if needed.
You may also want to identify your main retirement goals:
- Retire Early
- Spend the Maximum (Die with Zero)
- Maximize your Estate
💡 Tip: Run multiple projections with different assumptions (e.g., conservative vs. optimistic returns) to see your “range of outcomes.”
2. Are You Paying Too Much in Fees?
Investment fees may not seem like much year to year, but they quietly erode your wealth over time.
A portfolio with 1.5% annual fees may lose tens of thousands in potential returns over a 20+ year retirement. That’s money that could have paid for vacations, healthcare, or boosted peace of mind.
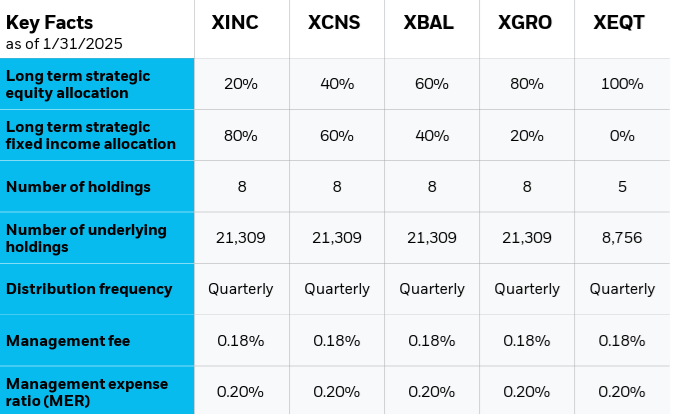
One of the most effective ways to reduce fees is to switch to low-cost, globally diversified ETFs—particularly all-in-one solutions like XEQT or ZEQT. These can simplify portfolio management and save you thousands in fees while maintaining proper asset allocation.
💡 Tip: Check the MER (Management Expense Ratio) on every fund you own. Anything over 0.50% deserves a second look.
3. Are You Paying More Taxes Than Necessary?
Taxes don’t retire when you do. In fact, they often become more complex.
Drawing from your RRSP, TFSA, and non-registered accounts in the wrong sequence can push you into higher tax brackets—even if your spending hasn’t changed. Many retirees overpay simply because their withdrawal strategy wasn’t optimized.
The key is to aim for a stable average tax rate across your retirement years—not just minimizing tax today. That might mean withdrawing from RRSPs earlier than you expected, or deferring CPP/OAS in favor of drawing on taxable investments.
💡 Tip: Work on various scenarios. Keep the average tax rate as steady as possible.
4. Can You Spend More Without Worry?
This question surprises many retirees—but it’s one of the most important.
After years of diligent saving, many people struggle to enjoy their money. They worry about spending too much too soon, or about the next market downturn. Ironically, this cautious mindset can prevent you from living the retirement you worked so hard for.
One solution is an agile spending plan—a flexible model that adapts to your portfolio’s performance. If markets do well, you increase spending. If they don’t, you temporarily tighten the belt. It’s not about deprivation—it’s about confidence and control.
💡 Tip: Run your projections each year as if it were your first retirement day.
5. What If the Market Crashes?
Remember 2008? I do…
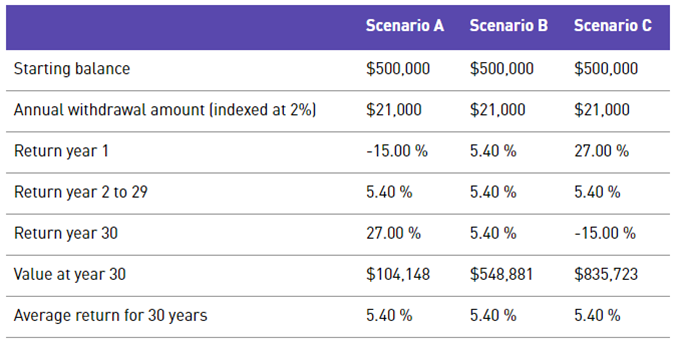
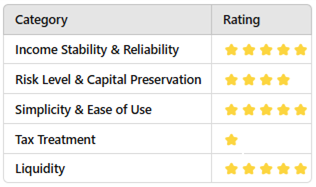
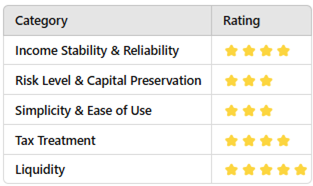
One of the most effective ways to manage a market crash is to use a cash reserve—a buffer of liquid, low-risk funds outside the market. A cash reserve is money you set aside in a high-interest savings account, money market fund, or short-term GICs—not in the market.
During a bear market, you can draw from your cash reserve, giving your investments time to recover.
💡 Tip: Stress-test your portfolio. I have given an example here.
I have covered more about the cash wedge in the article below.
Putting It All Together
Retirement confidence doesn’t come from beating the market. It comes from clarity. When you can answer these five questions with conviction, you free yourself to focus on what matters most: living well.
-
You know where your money is going.
-
You know how to reduce the silent threats (fees, taxes, inflation).
-
You know how to adapt your plan without panic.
-
And perhaps most importantly, you know you’ve done the work.
There’s no one-size-fits-all retirement plan—but there is a framework that makes it easier to build one that fits you.
Bonus Resource: Want to Go Deeper?
We recently shared a full breakdown of this framework in our retirement planning webinar. If you’d like to see real-world examples and visuals that bring these concepts to life, you can watch the replay here:
Ready to Take the Next Step?
If reading this sparked other questions—you’re not alone. Many DIY investors feel unsure during the transition into retirement.
In fact, if you’ve ever thought:
“I’m not sure how much I can safely spend…”
“I keep second-guessing my withdrawal plan…”
“What happens to my portfolio if the market drops again?”
“How will CPP, OAS, and taxes really affect my income?”
…then it’s time to get support.
That’s why I created Retirement Loop: a community for Canadians who want to retire with clarity—not questions.
Inside Retirement Loop, you’ll get:

✅ A downloadable projection spreadsheet (you own the data)
✅ Personalized support from our retirement coaches
✅ A private community of 500+ Canadians navigating retirement together
✅ Step-by-step learning modules and monthly live events
✅ Tools to optimize your plan for income, taxes, fees, and peace of mind
It’s everything you need to stop second-guessing your plan and start feeling in control.
📌 Membership is now open—but only for a limited time.
Doors close soon, so we can focus on helping current members build their retirement path.
👉 Click here to join Retirement Loop and get instant access to everything.


 Not at all. You must invest in sectors that fit with your goals, i.e., stability vs growth, and that you understand.