Thomson-Reuters (TRI.TO) seems pretty boring. After all, software and services for lawyers, accountants, and corporations don’t make us jump to our feet excitedly. However, with a market cap of $110B CAD, 31 consecutive years of dividend increases, and 5-year total returns of 200%, Thomson-Reuters is an industrial stock that is anything but boring.
You can also listen to Mike’s podcast.
Formed in 2008 with the merger of Thomson and Reuters, TRI.TO is mostly known to the general public for its news service and media, but this only represents a few percentage points of its total revenue. Thomson-Reuters’s largest business is selling complex software and services for the legal profession (42% of its revenue), accounting profession (20-25%), and corporations (20-25%). The company was also in the financial data service, with Refinitiv, which it sold to the London Stock Exchange in 2019.
TRI’s Legal Professionals segment sells research and workflow products to law firms and governments. The Tax & Accounting Professionals segment does the same, but for tax, accounting and audit professionals in accounting firms. Its Corporates segment sells a full suite of content-driven technology solutions for small businesses all the way to multinational organizations, including the seven global accounting firms.
Create your own income. Learn how in our Dividend Income for Life Guide!
What’s to like about Thomson-Reuters?
TRI’s generates 80% of its revenue from subscription-based services; this predictable revenue and cash flow is great, as long as the customers stick around. This brings us another strength of Thomson-Reuters: its sticky business model. It sells products and services for complex and regulated domains such as law and accounting.
Through its WestLaw business unit, TRI offers an important service to lawyers. Law firms don’t have the time to jump from one provider to another. With WestLaw and Checkpoint, the tax & accounting software, Thomson-Reuters offers top-of-the-line software to two stable industries. Implementing and learning these services required a high degree if involvement from both TRI and the customers, which tends to cement the relationship between them.
This large customer base to offer cross-selling opportunities. Corporate clients have legal and accounting departments, law firms have accounting departments, etc.
The company generates steady organic growth throughout all segments. The pivot towards cloud-based software should allow it to lower acquisition costs while keeping its existing customer base. The complexity of its fields of business provides a strong barrier to entry against competitors. TRI is well-diversified geographically and enjoys a strong brand name.
The company is heavily investing in innovation, particularly in generative AI, to capitalize on the rising complexity of regulatory compliance and the demand for AI-driven solutions. It made notable progress with products like Westlaw Precision and CoCounsel, and the integration of Pagero to enhance corporate tax and audit capabilities.
Last quarter, Thomson Reuters reported solid results with revenue up 8.5% and EPS up 36%. Total organic revenue growth was 9%, with the “Big 3” segments growing by 10%, driven by strong transactional revenue and seasonal offerings. By segment, growth was as follows: Legal +7%, Corporate +12%, and Tax & Accounting +14%.
Potential Risks for TRI.TO
Selling its Financial and Risk (FR) segment brought in a good amount of cash, but reduced TRI’s business diversification. Following the transaction, TRI’s legal services now represent close to half of their revenues. While this segment is quite stable, it does not show rapid growth. A new technology emerging disrupting TRI’s financial legal services isn’t impossible either. TRI is an important shareholder of the London Stock Exchange (LSE) with a 15% stake. This participation is subject to market fluctuations and highly cyclical volumes.
While TRI counts on its Big 3 segments, the rest of its businesses (news and print) could adversely affect margins and slow overall growth. Finally, we saw TRI’S margin being affected by higher inflation in recent quarters. Multiyear contracts take time to reflect price increases.
TRI.TO Dividend Growth Perspective
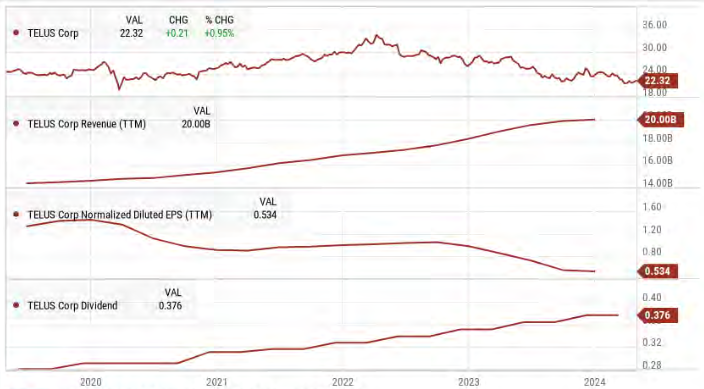
Thomson Reuters has increased its dividend every year since 1993, but its dividend growth rate is not very impressive.
Selling Refinitiv in 2019 brought in a healthy infusion of cash into the business. Management bought back shares and authorized another 5M in share buybacks. An investor can expect a low single-digit dividend growth rate from now on, perhaps with nice surprises along the way as we were in 2022 with the 10% dividend increase, followed by another one in 2023. TRI did not disappoint in 2024 with another 10% increase.
Thomson-Reuters pays its dividend in USD.
Create your own income. Download our Dividend Income for Life Guide!
Final Thoughts on Thomson-Reuters
At 1.25% dividend yield, Thomson-Reuters is a low yield stock. It is also high growth. Total returns over 5 years were 200%! TRI has a stable business model that generates consistent cash flow. With its yearly dividend increased, TRI management is showing its confidence for the future.
Management increased the dividend by 10% in early 2024 and expects to buy back for $1B worth of share. Full-year 2024 outlook expects organic revenue growth of approximately 6%.
TRI.TO stock is trading at a high valuation. It’s trading at a lower P/E ratio than its five-year average, but a P/E ratio of 33 and a Fwd P/E ratio of 44 might give you reason to pause. With market expectations high, will Thomson-Reuter be able to innovate to keep high-single digit revenue growth going? It’s certainly worth a look.

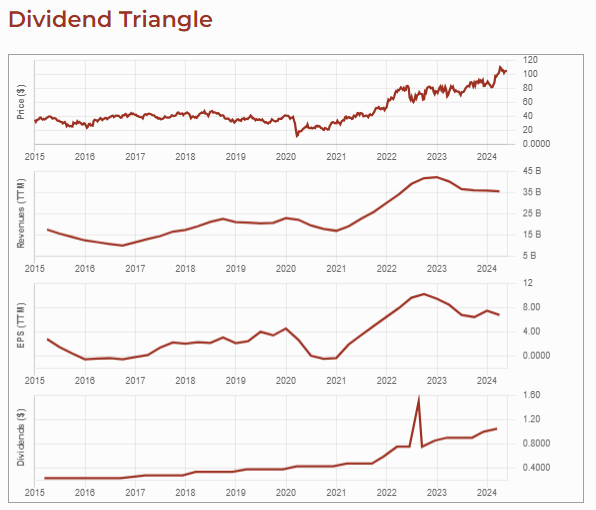
 But CNR is more than railway transport! Its services also include intermodal, trucking, and supply chain services. CNR’s rail services offer equipment, customs brokerage services, transloading and distribution, private car storage, and more. Intermodal container services help shippers expand their door-to-door market reach with ~23 strategically placed intermodal terminals. These services include temperature-controlled cargo, port partnerships, logistics parks, moving grain in containers, custom brokerage, transloading and distribution, and others. Trucking services include door-to-door service, import and export dray, interline services, and specialized services.
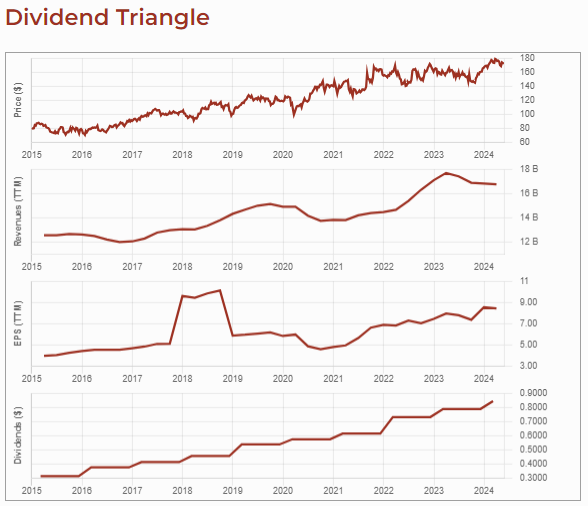
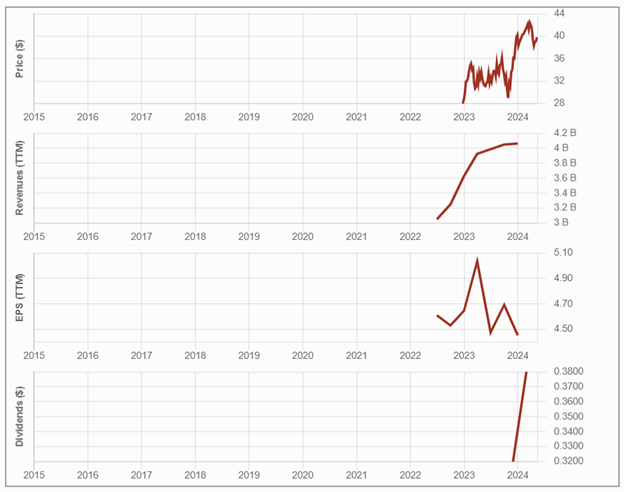
 In early May, Brookfield Asset Management reported a good Q1 2024. It showed strong growth of 15% in its fee revenue from its flagship, private credit, and insurance strategies over the past year, on the back of over 15% growth in related fee-bearing capital over the same period. BAM saw lower transaction fees and lower fees associated with its permanent capital vehicles. BAM raised $20B of capital during the quarter, compared with $37B in Q4 2023.