Every trade, listing, and market movement in Canada traces back to one place — the TMX. But beyond the flashing tickers and daily headlines, this company has built something far more enduring: a stable, cash-generating machine that fuels dividend growth year after year. For investors seeking predictability in an unpredictable market, TMX represents the steady pulse behind Canadian capitalism itself.
The Core Engine Behind Canadian Markets
TMX Group (X.TO) operates the infrastructure that keeps Canada’s markets running. It owns and manages the Toronto Stock Exchange (TSX), TSX Venture Exchange, and Montreal Exchange, while also overseeing clearing and settlement systems through CDS and CDCC. Together, these businesses handle nearly all equity and derivatives trading in Canada — an advantage few competitors can touch.
Over time, TMX has evolved well beyond the traditional exchange model. Its data and analytics divisions — including Datalinx, Trayport, and the newly acquired VettaFi — now deliver global market data and analytics to thousands of clients. More than half of TMX’s revenue comes from recurring contracts, giving it resilience that’s rare among financial infrastructure firms.
The Investment Thesis: Stability in a Market Built on Movement
Bull Case — The Exchange That Keeps Growing
TMX has transformed itself from a cyclical exchange operator into a diversified fintech platform. Its monopoly on Canadian listings ensures a steady base of transaction and listing fees, while expanding data capabilities are driving higher-quality, recurring cash flow.
Playbook:
TMX earns revenue through trading, clearing, listings, and data. Its flagship exchanges — the TSX and MX — dominate Canadian equities and derivatives. The company’s strategy has been to expand globally through acquisitions like VettaFi and iNDEX Research, strengthening its position in the booming data and analytics space.
Growth Vectors:
- Recurring data revenue now exceeds 50% of total sales, insulating TMX from volume swings.
- Trayport and VettaFi have delivered double-digit growth in 2025, confirming successful integration.
- Issuer services are rebounding as capital markets regain momentum.
- EPS growth is projected to stay in double digits through 2026, supported by margin expansion and disciplined capital allocation.
Economic Moat:
TMX enjoys one of the strongest competitive positions in the country. Its regulatory entrenchment and control of national market infrastructure make it nearly impossible to replicate. While global exchanges compete for data and technology clients, TMX’s grip on Canadian listings and clearing systems forms a wide and stable moat for long-term investors.
Bear Case — Even Giants Can Catch the Market’s Cold
Even with diversification, TMX’s performance still depends partly on the health of equity markets. A prolonged downturn in trading or IPO activity could soften revenue growth, while operating leverage can cut into margins during weaker cycles.
Business Vulnerabilities:
TMX’s core exposure to market volumes and capital formation leaves it sensitive to investor sentiment. While recurring revenue helps, transaction-driven income remains significant — and difficult to replace if listings dry up.
Industry & Market Threats:
- Capital migration risk to U.S. exchanges if domestic listings falter.
- Rising competition from alternative trading systems (NEO, Nasdaq Canada, CSE) could erode share at the margins.
- Continuous reinvestment in technology is mandatory to keep pace with global giants like ICE and Nasdaq.
Competitive Landscape:
TMX’s leadership in Canada is secure, but it faces indirect competition from international exchanges expanding into fintech and data analytics. Continued success depends on disciplined integration of new acquisitions and sustained innovation in data solutions.
Unlock More Dividend Growth Picks
 If you want more hand-picked dividend growers across industries, grab our Dividend Rock Star List.
It features around 300 stocks with complete Dividend Safety Scores, growth projections, and buy lists tailored for retirement portfolios.
Most importantly, it is the ONLY list using the Dividend Triangle as its foundation.
Latest News — Data Drives Another Strong Quarter
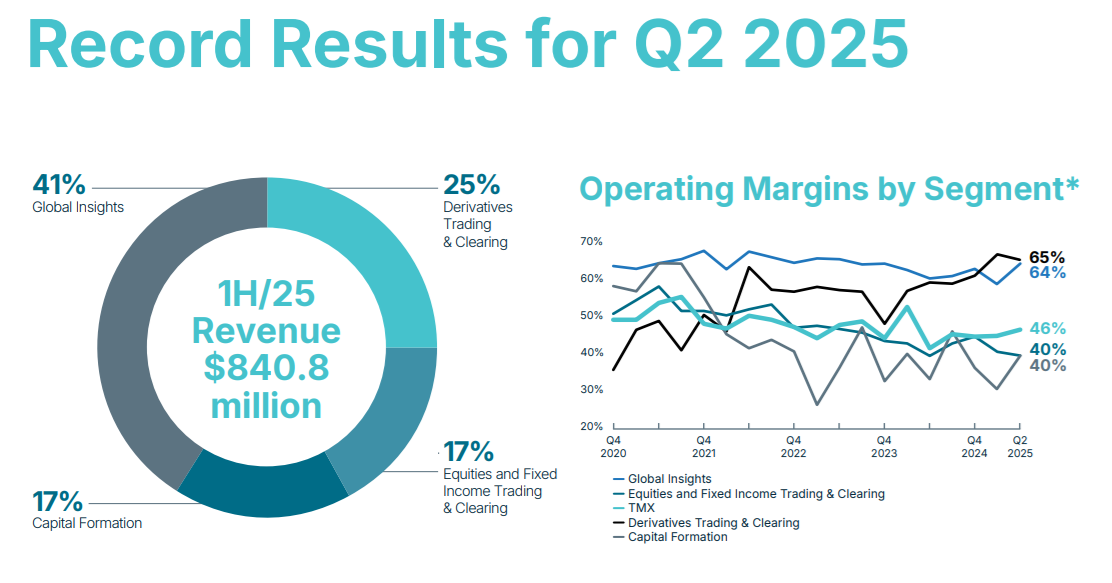
TMX Group reported a solid quarter with revenue up 15% and adjusted EPS up 21%. GAAP EPS was down 28%, reflecting a $0.14 loss per share related to foreign exchange impacts in Q2.
Organic revenue, excluding recent acquisitions such as Newsfile, iNDEX Research, Bond Indices, and ETF Stream, grew 13%, fueled by strong performance across:
- Derivatives trading and clearing: +33%
- TMX Trayport: +26%
- Equities & fixed income trading: +18%
- TMX VettaFi: +17%
This reinforces TMX’s strategy of broadening its data ecosystem and maintaining diversified growth across core and adjacent businesses.
The Dividend Triangle in Motion
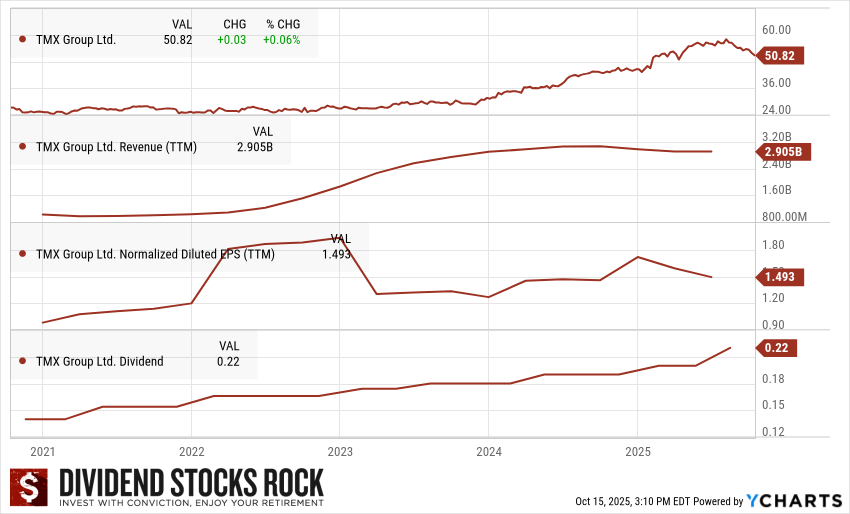
TMX’s Dividend Triangle reflects a company quietly compounding shareholder value — with consistent growth in revenue, earnings, and dividends.
- Revenue: $2.9 billion and growing, thanks to steady trading and expanding data operations.
- Earnings per Share (EPS): $1.49 TTM, backed by recurring income and disciplined cost management.
- Dividend: $0.22 per share, with a solid history of increases supported by healthy free cash flow.
Final Thoughts — Owning the Exchange Pays Off
TMX isn’t the kind of stock that will double overnight, but that’s exactly what makes it attractive to dividend growth investors. Its dominance in the Canadian market infrastructure, growing data monetization engine, and consistent free cash flow generation make it a rare blend of stability and modern innovation.
For those seeking long-term compounding, TMX offers something uniquely Canadian — a steady dividend backed by the country’s financial foundation.
Want to Discover More Canadian Dividend Stars?
Join thousands of investors who rely on our Dividend Rock Star List to find dependable dividend growers across Canada and the U.S.
👉 Download your free Dividend Rock Star List today