It’s not flashy, it doesn’t have thousands of branches, and it definitely doesn’t get the media attention of Canada’s Big 6. But this bank has quietly built a niche in one of the most profitable corners of the financial sector — and it keeps delivering.
EQB Inc. (EQ Bank) blends digital efficiency with high-margin lending, and while the road isn’t always smooth, it continues to grow, raise its dividend, and find ways to outmaneuver bigger competitors. That’s exactly why I keep watching.
Business Model: Digital-First, Credit-Focused
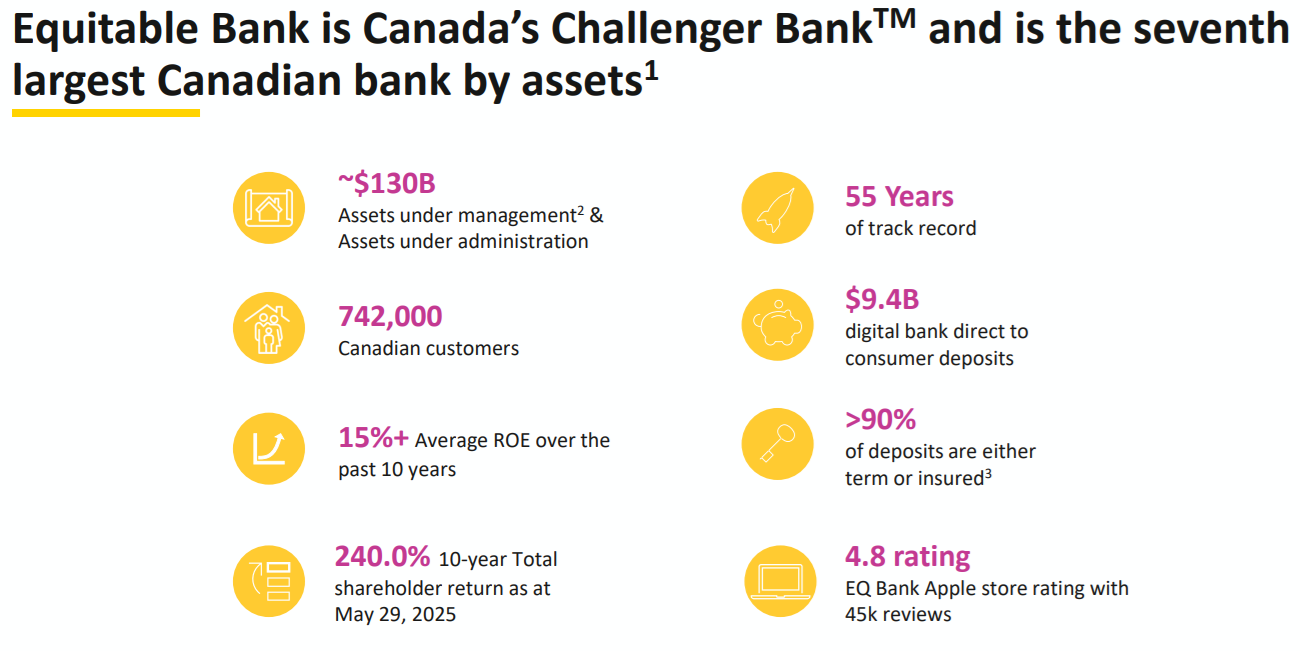
EQB is a challenger bank that’s carved out its niche by focusing on alternative-A mortgage lending, commercial real estate loans, and a 100% digital banking platform. Through EQ Bank, it offers high-interest savings accounts, GICs, and personal lending products — all without branches.
On the commercial side, it’s expanded into equipment leasing, multi-unit residential financing, and business lending through strategic fintech and credit union partnerships. The result? A growing loan book, solid margins, and a nationwide customer base that now tops 560,000.
Unlike traditional banks, EQB lends to self-employed individuals, newcomers, and businesses that don’t always check all the Big Bank boxes. That adds risk — but also reward.
Investment Thesis: The Right Niche, The Right Time
EQB has done an impressive job turning its smaller size into an advantage. Its fully digital platform means lower costs, faster innovation, and no legacy branch network dragging it down. Instead, it focuses on tech-enabled growth: direct-to-consumer banking, alternative mortgage lending, and commercial finance.
What sets EQB apart is its ability to serve customers that others overlook — and do it profitably. Its net interest margins are among the highest in the industry, thanks to higher-yielding loans and a more agile model.
Yes, it’s not immune to credit cycles. But this is a stock that’s grown steadily over the past five years, raised its dividend regularly, and delivered a solid return for investors willing to go beyond the Big 6. That makes it a name worth watching — or holding.
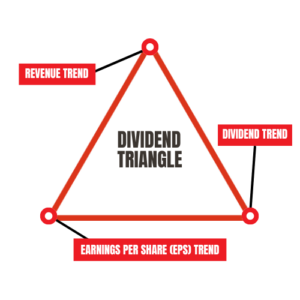
The Dividend Triangle in Action: Growth with a Side of Volatility
Let’s run EQB through the Dividend Triangle and see if it still checks the right boxes despite a bumpy quarter.
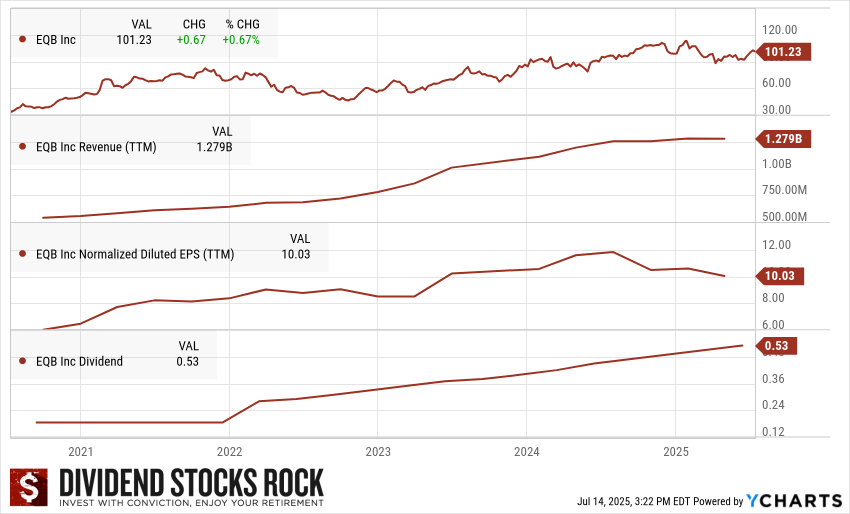
1. Revenue Growth: Revenue stands at $1.279B, nearly doubling over the past few years as EQB expanded its loan book and deposit base.
2. Earnings Growth: EPS currently sits at $10.03, though it’s dipped due to higher provisions for credit losses (PCLs). Long term, the trend remains positive despite short-term volatility.
3. Dividend Growth: The dividend now stands at $0.53, up again by 4% last quarter. That’s steady growth for a company reinvesting heavily while still rewarding shareholders.
Summary: EQB passes the Dividend Triangle test — even if earnings hit speed bumps, its top line and dividend trend continue to move in the right direction.
The ONLY List Using the Dividend Triangle
After this first example, you may wonder how I was able to differentiate these positions.

I analyze companies according to their dividend triangle (revenue, earnings, and dividend growth trends), combined with their business model and growth vectors. While this may seem too simple, two decades of investing have shown me it is reliable.
While many seasoned investors also use these metrics in their analysis, no one has created a list based on them before. This is exactly why I created The Dividend Rock Stars List.
The Rock Stars List isn’t just about yield—it’s built using a multi-step screening process to ensure the highest-quality dividend stocks. You can read more about it or enter your name and email below to get the instant download in your mailbox.
Bull Case: Undervalued and Underappreciated
EQB might not get the spotlight like the Big Banks, but its fundamentals are compelling:
-
Higher NIMs and lower costs thanks to its digital-first model
-
Niche mortgage lending to underserved segments = stronger yields
-
Commercial finance growth = new profit centers
-
Fintech partnerships & open banking readiness position EQB well for the future
-
Consistent dividend hikes + long-term loan growth
It’s lean, focused, and still has room to scale — especially outside the Big Bank footprint.
Bear Case: Credit Risk and Rate Sensitivity
Still, this isn’t a stock for the risk-averse:
-
Rising PCLs (up 36% last quarter) show pressure in equipment & commercial lending
-
EPS dropped 17%, reminding us that loan quality can shift quickly
-
Sensitive to interest rate changes and tighter regulations
-
Commercial loan exposure could drag returns if the economy slows
-
Not “too big to fail” — lacks the stability of Big 6 peers
It’s a bank that works well in calm markets — but needs careful monitoring when the environment gets rocky.
Latest News: Soft Quarter, but the Growth Continues
EQB’s most recent quarter was mixed:
-
Revenue flat | EPS -17%
-
Net interest income +1% | NIM 2.20%
-
EQ Bank customers +23% (to 560K)
-
Higher impaired loans + two commercial accounts added risk
-
Dividend increased 4% — again!
Even with some weakness, EQB’s management remains confident — and the long-term growth path is still intact.
Want to See My Full Breakdown?
If you want to hear more about why I’m keeping EQB on my radar — especially after a soft quarter — I’ve got you covered.
Watch the full EQ Bank analysis on YouTube:
In the video, I break down:
-
What’s driving EQB’s growth
-
What worries me about recent results
-
Where I see an opportunity going forward
Final Word: Lean, Digital, and Worth the Risk (for the Right Investor)
EQB isn’t for everyone. It doesn’t have the brand recognition or the scale of Canada’s Big 6. But that’s the point.
It’s leaner, faster, and focused on segments that others ignore — and it’s done a great job turning that into long-term growth. With a strong Dividend Triangle, regular dividend hikes, and a clear digital vision, EQB is the kind of stock that can reward patient investors willing to go off the beaten path.
Just be ready to hold on through the bumps.