Profit protection measures are ways in which investors sell their shares to safeguard existing profits, or to limit potential losses. How do investors do that? While protecting profits and limiting losses sounds like a wise thing to do, is it?
Profit protection is also known as profit preservation or risk management. Two ways of implementing profit protection are to set a profit cap at which you sell holdings and to use stop-sell orders.
Protect your retirement by making your portfolio recession-proof. Learn how in our free workbook. Download it now!
Profit cap rule
Some investors adopt rules for selling shares. For example, if they’re up 50% on a stock, they sell it. They are putting a cap on their profits, perhaps sometimes thinking that they got lucky and just want to run with a bag of money.
If you’re an active trader and you keep on buying and selling all the time, maybe this type of rule can be part of your strategy.
 I prefer to let my winners run so I don’t set rules like this to protect my profit. Over the past 20 years, I found that it’s worth holding on to your great picks—those companies that you were so right about buying. Letting them run 5, 10, 15 years, can create so much profit…300%, 400% sometimes even over 1000%!
Since my focus is on dividend growth, I have 90-95% of my portfolio invested in dividend-growing companies, which I plan on holding for a long time.
Stop-sell orders
Another mechanism investors use for profit protection is to set up stop-sell orders. Imagine you bought shares at $50, and they are now trading at $100. Perhaps you’re thinking “Wow! I’m making a 100% return on this one. That’s crazy. But I don’t want to sell it because, well, what if it keeps going up? On the other hand, if it starts falling, I don’t want to lose all that profit.”
You could put in a stop-sell order that is triggered at $75.00; if the stock goes down to this price, your order becomes active or open, shares are sold, and you cashed in on some of the profit.
My use of profit protection
I don’t adopt profit protection measures very often. As I said earlier, 90-95% of my portfolio are dividend growers that I want to hold for a long time without capping my profit. I believe that if my portfolio’s sector allocation is in good shape, that my holdings are well diversified across industries, that I picked the best of class, and I monitor their results and trends every quarter, I am protected.
However, for the remaining 5-10% of my portfolio, I like the occasional speculative plays, especially when there’s a lot of volatility in the market like in 2020 for example, where I could see opportunities. I never exceed 10% of my portfolio in speculative plays and limit them to three or four positions. With these speculative plays, I do sometimes use stop-sell orders to protect my profit.
 Something else that I do that relates to profit protection is to trim winning positions that are weighing too much in my portfolio.
My limit for any single position in my portfolio is 10%; that’s an arbitrary limit. Yes, I like to let my winners run, but I don’t want to wake up one day having 25% of all my investments in a single stock, even if it is a winner. After all, you can never be 100% about any stock, and certainly not about any company being able to thrive forever; competition changes, the economy changes, and consumer behavior changes.
For these reasons, I decided that I didn’t want to lose more than that 10% exposure on a specific stock and that whenever that 10% was exceeded, I would sell part of it automatically to bring the position back below or at my limit.
Protect your portfolio, make it recession-proof. Learn how in our free workbook. Download it now!
Is profit protection worth doing?
I think the value of profit protection has a lot to do with your strategy. If you’re an active trader or an investor who makes a lot of speculative plays, then yes, profit protection can play a role in your strategy.
While I do occasionally use stop-sell orders for my limited speculative plays, I don’t systematically implement profit protection measures. I prefer to protect my portfolio by trimming overweight positions rather than cashing in all my profit.
In the end, though, it still comes down to selling at a profit to protect against the impact of a potential loss by limiting a portion of the profit you make on a winning stock.
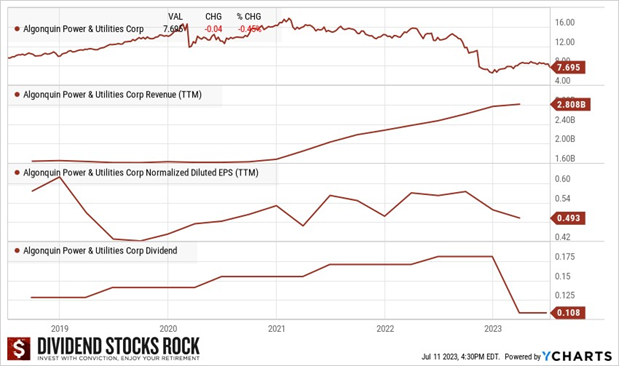
 To mitigate the risk of utilities having too much power, some countries, provinces, or states nationalized these resources to provide them at a lower price. Often, in Canada and the U.S., governments allow private companies to manage and distribute electricity, gas, and water. Granting such power to private entities couldn’t be done without strict rules. Hence, utilities usually operate in a highly regulated environment. Governments decide the price of power and water that is charged to customers.
 Most often, those projects are financed by issuing additional shares of stock or taking on more long-term debt. When interest rates rise, the cost of new financing increases, reducing the projected profitability of the project. In short, there will be less cash left to increase the dividend.